
Page 92 - Geothermal Energy Systems Exploration, Development, and Utilization
P. 92
68 2 Exploration Methods
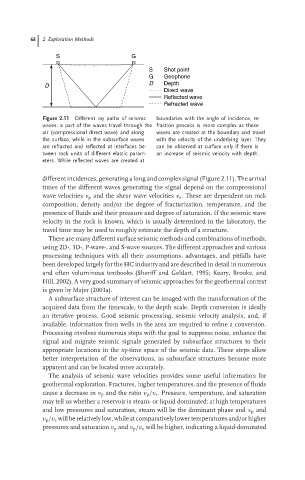
S G
S Shot point
G Geophone
D Depth
D
Direct wave
Reflected wave
Refracted wave
Figure 2.11 Different ray paths of seismic boundaries with the angle of incidence, re-
waves: a part of the waves travel through the fraction process is more complex as these
air (compressional direct wave) and along waves are created at the boundary and travel
thesurface, while in thesubsurfacewaves with the velocity of the underlying layer. They
are refracted and reflected at interfaces be- can be observed at surface only if there is
tween rock units of different elastic param- an increase of seismic velocity with depth.
eters. While reflected waves are created at
different incidences, generating a long and complex signal (Figure 2.11). The arrival
times of the different waves generating the signal depend on the compressional
wave velocities v p and the shear wave velocities v s . These are dependent on rock
composition, density and/or the degree of fracturization, temperature, and the
presence of fluids and their pressure and degree of saturation. If the seismic wave
velocity in the rock is known, which is usually determined in the laboratory, the
travel time may be used to roughly estimate the depth of a structure.
There are many different surface seismic methods and combinations of methods,
using 2D-, 3D-, P-wave-, and S-wave sources. The different approaches and various
processing techniques with all their assumptions, advantages, and pitfalls have
been developed largely for the HC industry and are described in detail in numerous
and often voluminous textbooks (Sheriff and Geldart, 1995; Keary, Brooks, and
Hill, 2002). A very good summary of seismic approaches for the geothermal context
is given by Majer (2003a).
A subsurface structure of interest can be imaged with the transformation of the
acquired data from the timescale, to the depth scale. Depth conversion is ideally
an iterative process. Good seismic processing, seismic velocity analysis, and, if
available, information from wells in the area are required to refine a conversion.
Processing involves numerous steps with the goal to suppress noise, enhance the
signal and migrate seismic signals generated by subsurface structures to their
appropriate locations in the xy-time space of the seismic data. These steps allow
better interpretation of the observations, as subsurface structures become more
apparent and can be located more accurately.
The analysis of seismic wave velocities provides some useful information for
geothermal exploration. Fractures, higher temperatures, and the presence of fluids
cause a decrease in v p and the ratio v p /v s . Pressure, temperature, and saturation
may tell us whether a reservoir is steam- or liquid dominated: at high temperatures
and low pressures and saturation, steam will be the dominant phase and v p and
v p /v s will be relatively low, while at comparatively lower temperatures and/or higher
pressures and saturation v p and v p /v s will be higher, indicating a liquid-dominated