
Page 146 - Global Tectonics
P. 146
132 CHAPTER 6
ESP 5 8 7 1
2.2
3 2.5
Extrusives
5.0
5.5
4 Brecciated dikes 6.0
3.0 6.5
4.0 Sheeted dikes
5
5.0 7.0 km/s
Depth (km) 6 5.5 6.0
LVZ
7
Gabbros
8
9
7.5
10 Interlayered mafics / ultramafics
Mantle ultramafics 8.0
2 1 0 1 2 3 4 5 6 7 8 9 10
W Distance (km) E
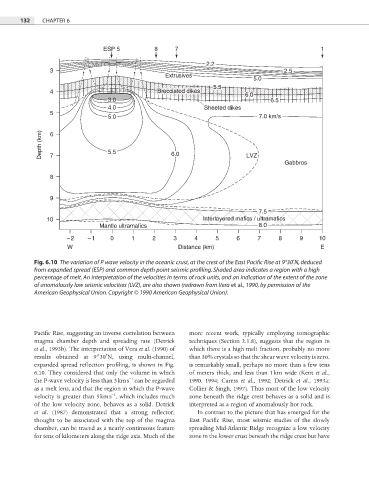
Fig. 6.10 The variation of P wave velocity in the oceanic crust, at the crest of the East Pacific Rise at 9°30′N, deduced
from expanded spread (ESP) and common depth point seismic profiling. Shaded area indicates a region with a high
percentage of melt. An interpretation of the velocities in terms of rock units, and an indication of the extent of the zone
of anomalously low seismic velocities (LVZ), are also shown (redrawn from Vera et al., 1990, by permission of the
American Geophysical Union. Copyright © 1990 American Geophysical Union).
Pacific Rise, suggesting an inverse correlation between more recent work, typically employing tomographic
magma chamber depth and spreading rate (Detrick techniques (Section 2.1.8), suggests that the region in
et al., 1993b). The interpretation of Vera et al. (1990) of which there is a high melt fraction, probably no more
results obtained at 9°30′N, using multi-channel, than 30% crystals so that the shear wave velocity is zero,
expanded spread refl ection profiling, is shown in Fig. is remarkably small, perhaps no more than a few tens
6.10. They considered that only the volume in which of meters thick, and less than 1 km wide (Kent et al.,
−1
the P-wave velocity is less than 3 km s can be regarded 1990, 1994; Caress et al., 1992; Detrick et al., 1993a;
as a melt lens, and that the region in which the P-wave Collier & Singh, 1997). Thus most of the low velocity
−1
velocity is greater than 5 km s , which includes much zone beneath the ridge crest behaves as a solid and is
of the low velocity zone, behaves as a solid. Detrick interpreted as a region of anomalously hot rock.
et al. (1987) demonstrated that a strong refl ector, In contrast to the picture that has emerged for the
thought to be associated with the top of the magma East Pacific Rise, most seismic studies of the slowly
chamber, can be traced as a nearly continuous feature spreading Mid-Atlantic Ridge recognize a low velocity
for tens of kilometers along the ridge axis. Much of the zone in the lower crust beneath the ridge crest but have