
Page 187 -
P. 187
The Beginning and the End? • 161
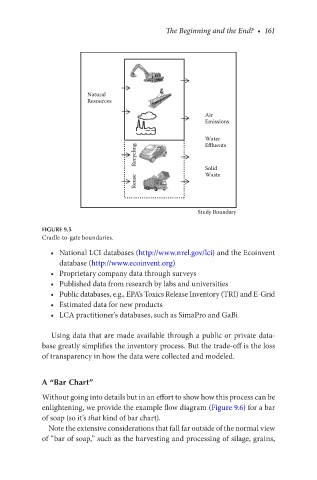
Natural
Resources
Air
Emissions
Water
Effluents
Recycling
Solid
Waste
Reuse
Study Boundary
Figure 9.5
Cradle-to-gate boundaries.
• National LCI databases (http://www.nrel.gov/lci) and the Ecoinvent
database (http://www.ecoinvent.org)
• Proprietary company data through surveys
• Published data from research by labs and universities
• Public databases, e.g., EPA’s Toxics Release Inventory (TRI) and E-Grid
• Estimated data for new products
• LCA practitioner’s databases, such as SimaPro and GaBi
Using data that are made available through a public or private data-
base greatly simplifies the inventory process. But the trade-off is the loss
of transparency in how the data were collected and modeled.
a “Bar Chart”
Without going into details but in an effort to show how this process can be
enlightening, we provide the example flow diagram (Figure 9.6) for a bar
of soap (so it’s that kind of bar chart).
Note the extensive considerations that fall far outside of the normal view
of “bar of soap,” such as the harvesting and processing of silage, grains,