Page 222 - Handbook of Thermal Analysis of Construction Materials
P. 222

Section 3.0 - Non-Chloride Accelerators                      205


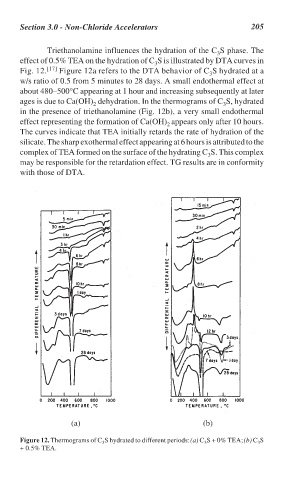
                                     Triethanolamine influences the hydration of the C S phase. The
                                                                                  3
                              effect of 0.5% TEA on the hydration of C S is illustrated by DTA curves in
                                                                  3
                              Fig. 12. [17]  Figure 12a refers to the DTA behavior of C S hydrated at a
                                                                                3
                              w/s ratio of 0.5 from 5 minutes to 28 days. A small endothermal effect at
                              about 480–500°C appearing at 1 hour and increasing subsequently at later
                              ages is due to Ca(OH)  dehydration. In the thermograms of C S, hydrated
                                                 2                                  3
                              in the presence of triethanolamine (Fig. 12b), a very small endothermal
                              effect representing the formation of Ca(OH) appears only after 10 hours.
                                                                     2
                              The curves indicate that TEA initially retards the rate of hydration of the
                              silicate. The sharp exothermal effect appearing at 6 hours is attributed to the
                              complex of TEA formed on the surface of the hydrating C S. This complex
                                                                                3
                              may be responsible for the retardation effect. TG results are in conformity
                              with those of DTA.


                                           (a)                                (b)

                              Figure 12. Thermograms of C S hydrated to different periods: (a) C S + 0% TEA; (b) C S
                                                                                             3
                                                    3
                                                                               3
                              + 0.5% TEA.
   217   218   219   220   221   222   223   224   225   226   227