Page 292 - Handbook of Thermal Analysis of Construction Materials
P. 292

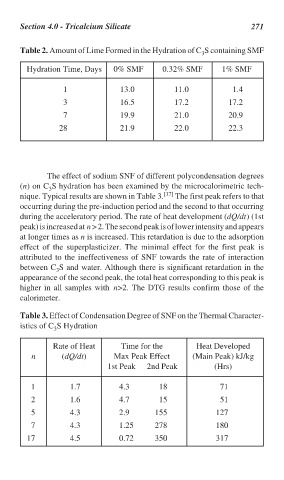
Section 4.0 - Tricalcium Silicate                            271


                              Table 2. Amount of Lime Formed in the Hydration of C S containing SMF
                                                                              3
                                Hydration Time, Days   0% SMF       0.32% SMF      1% SMF


                                         1              13.0           11.0           1.4
                                         3              16.5           17.2          17.2
                                         7              19.9           21.0          20.9
                                        28              21.9           22.0          22.3


                                     The effect of sodium SNF of different polycondensation degrees
                              (n) on C S hydration has been examined by the microcalorimetric tech-
                                     3
                              nique. Typical results are shown in Table 3. [17]  The first peak refers to that
                              occurring during the pre-induction period and the second to that occurring
                              during the acceleratory period. The rate of heat development (dQ/dt) (1st
                              peak) is increased at n > 2. The second peak is of lower intensity and appears
                              at longer times as n is increased. This retardation is due to the adsorption
                              effect of the superplasticizer. The minimal effect for the first peak is
                              attributed to the ineffectiveness of SNF towards the rate of interaction
                              between C S and water. Although there is significant retardation in the
                                       3
                              appearance of the second peak, the total heat corresponding to this peak is
                              higher in all samples with  n>2. The DTG results confirm those of the
                              calorimeter.

                              Table 3. Effect of Condensation Degree of SNF on the Thermal Character-
                              istics of C S Hydration
                                       3
                                       Rate of Heat      Time for the        Heat Developed
                                 n       (dQ/dt)       Max Peak Effect      (Main Peak) kJ/kg
                                                     1st Peak   2nd Peak         (Hrs)

                                 1         1.7          4.3        18              71
                                 2         1.6          4.7        15              51
                                 5         4.3          2.9       155             127
                                 7         4.3          1.25      278             180

                                17         4.5          0.72      350             317
   287   288   289   290   291   292   293   294   295   296   297