
Page 152 - Geology and Geochemistry of Oil and Gas
P. 152
122 DISPERSED ORGANIC MATTER
TABLE 7.2
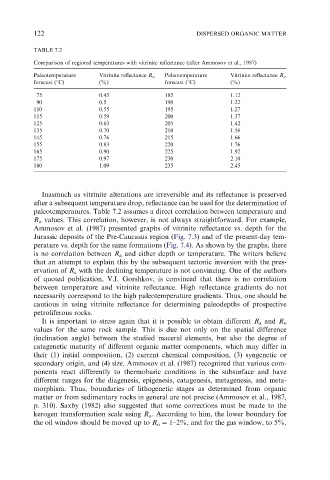
Comparison of regional temperatures with vitrinite reflectance (after Ammosov et al., 1987)
Paleotemperature Vitrinite reflectance R o Paleotemperature Vitrinite reflectance R o
forecast (1C) (%) forecast (1C) (%)
75 0.45 185 1.12
90 0.5 190 1.22
110 0.55 195 1.27
115 0.59 200 1.37
125 0.63 205 1.42
135 0.70 210 1.56
145 0.76 215 1.66
155 0.83 220 1.76
165 0.90 225 1.92
175 0.97 230 2.10
180 1.09 235 2.45
Inasmuch as vitrinite alterations are irreversible and its reflectance is preserved
after a subsequent temperature drop, reflectance can be used for the determination of
paleotemperatures. Table 7.2 assumes a direct correlation between temperature and
R o values. This correlation, however, is not always straightforward. For example,
Ammosov et al. (1987) presented graphs of vitrinite reflectance vs. depth for the
Jurassic deposits of the Pre-Caucasus region (Fig. 7.3) and of the present-day tem-
perature vs. depth for the same formations (Fig. 7.4). As shown by the graphs, there
is no correlation between R a and either depth or temperature. The writers believe
that an attempt to explain this by the subsequent tectonic inversion with the pres-
ervation of R a with the declining temperature is not convincing. One of the authors
of quoted publication, V.I. Gorshkov, is convinced that there is no correlation
between temperature and vitrinite reflectance. High reflectance gradients do not
necessarily correspond to the high paleotemperature gradients. Thus, one should be
cautious in using vitrinite reflectance for determining paleodepths of prospective
petroliferous rocks.
It is important to stress again that it is possible to obtain different R a and R o
values for the same rock sample. This is due not only on the spatial difference
(inclination angle) between the studied maceral elements, but also the degree of
catagenetic maturity of different organic matter components, which may differ in
their (1) initial composition, (2) current chemical composition, (3) syngenetic or
secondary origin, and (4) size. Ammosov et al. (1987) recognized that various com-
ponents react differently to thermobaric conditions in the subsurface and have
different ranges for the diagenesis, epigenesis, catagenesis, metagenesis, and meta-
morphism. Thus, boundaries of lithogenetic stages as determined from organic
matter or from sedimentary rocks in general are not precise (Ammosov et al., 1987,
p. 310). Saxby (1982) also suggested that some corrections must be made to the
kerogen transformation scale using R o . According to him, the lower boundary for
the oil window should be moved up to R o ¼ 1–2%, and for the gas window, to 5%.