
Page 159 - Geology and Geochemistry of Oil and Gas
P. 159
128 DISPERSED ORGANIC MATTER
Rogozing (1992), Kartsev (1984), Kontorovich (1991), and others explained this by
the migration of more reduced portion of bitumens into the reservoir rocks. Lab-
oratory modeling based on chromatographic studies (e.g., Yermakova et al., 1988)
showed that, after a slight thermal treatment (under 300 1C), the tar generates hy-
drocarbons, such as n-alkanes and isoprenoids. Reactions of hydrolysis of esters,
decarboxylation of acids, and dehydration of alcohol have also been established.
It was found that the composition and content of bitumen change in the section.
This was linked to the zonation of oil and gas generation in sedimentary section and
resulted in the development of concept of the ‘‘main phase of oil and gas generation’’
(oil and gas window).
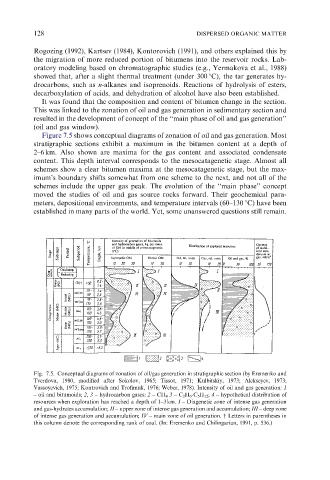
Figure 7.5 shows conceptual diagrams of zonation of oil and gas generation. Most
stratigraphic sections exhibit a maximum in the bitumen content at a depth of
2–6 km. Also shown are maxima for the gas content and associated condensate
content. This depth interval corresponds to the mesocatagenetic stage. Almost all
schemes show a clear bitumen maxima at the mesocatagenetic stage, but the max-
imum’s boundary shifts somewhat from one scheme to the next, and not all of the
schemes include the upper gas peak. The evolution of the ‘‘main phase’’ concept
moved the studies of oil and gas source rocks forward. Their geochemical para-
meters, depositional environments, and temperature intervals (60–130 1C) have been
established in many parts of the world. Yet, some unanswered questions still remain.
Fig. 7.5. Conceptual diagrams of zonation of oil/gas generation in stratigraphic section (by Eremenko and
Tverdova, 1980, modified after Sokolov, 1965; Tissot, 1971; Kulbitskiy, 1973; Alekseyev, 1973;
Vassoyevich, 1975; Kontrovich and Trofimuk, 1976; Weber, 1978). Intensity of oil and gas generation: 1
– oil and bitumoids; 2, 3 – hydrocarbon gases: 2 – CH 4 3 – C 2 H 6 -C 5 H 12 ; 4 – hypothetical distribution of
resources when exploration has reached a depth of 1–3km. I – Diagenetic zone of intense gas generation
and gas-hydrates accumulation; II – upper zone of intense gas generation and accumulation; III – deep zone
of intense gas generation and accumulation; IV – main zone of oil generation. y Letters in parentheses in
this column denote the corresponding rank of coal. (In: Eremenko and Chilingarian, 1991, p. 536.)