
Page 155 - HVAC Pump Handbook
P. 155
Rishel_CH06.qxd 20/4/06 6:06 PM Page 152
HVAC Pump Performance
152 HVAC Pumps and Their Performance
90
50%
60%
80
75%
85%
70
Best
88% 88% efficiency
area
System and pump head—ft 50
60
40
30
20
10
0
0 1000 2000 3000 4000
System flow—GPM
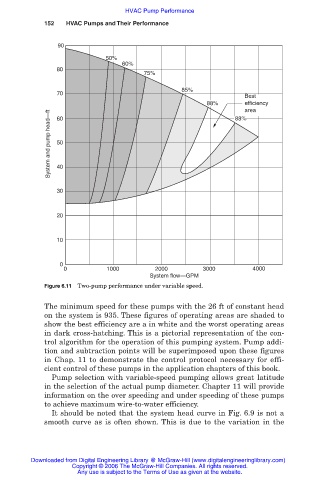
Figure 6.11 Two-pump performance under variable speed.
The minimum speed for these pumps with the 26 ft of constant head
on the system is 935. These figures of operating areas are shaded to
show the best efficiency are a in white and the worst operating areas
in dark cross-hatching. This is a pictorial representation of the con-
trol algorithm for the operation of this pumping system. Pump addi-
tion and subtraction points will be superimposed upon these figures
in Chap. 11 to demonstrate the control protocol necessary for effi-
cient control of these pumps in the application chapters of this book.
Pump selection with variable-speed pumping allows great latitude
in the selection of the actual pump diameter. Chapter 11 will provide
information on the over speeding and under speeding of these pumps
to achieve maximum wire-to-water efficiency.
It should be noted that the system head curve in Fig. 6.9 is not a
smooth curve as is often shown. This is due to the variation in the
Downloaded from Digital Engineering Library @ McGraw-Hill (www.digitalengineeringlibrary.com)
Copyright © 2006 The McGraw-Hill Companies. All rights reserved.
Any use is subject to the Terms of Use as given at the website.