
Page 9 - HVAC Pump Handbook
P. 9
Rishel_CH01.qxd 20/4/06 5:11 PM Page 6
Digital Electronics and HVAC Pumps
6 The Basic Tools
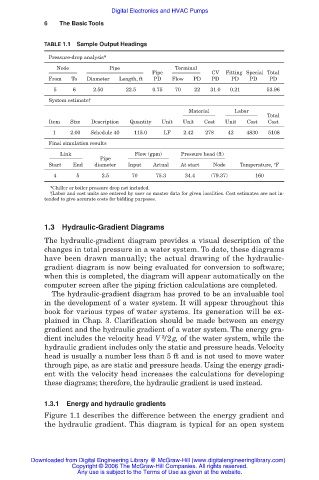
TABLE 1.1 Sample Output Headings
Pressure-drop analysis*
Node Pipe Terminal
Pipe CV Fitting Special Total
From To Diameter Length, ft PD Flow PD PD PD PD PD
5 6 2.50 22.5 0.75 70 22 31.0 0.21 53.96
System estimate†
Material Labor
Total
Item Size Description Quantity Unit Unit Cost Unit Cost Cost
1 2.00 Schedule 40 115.0 LF 2.42 278 42 4830 5108
Final simulation results
Link Flow (gpm) Pressure head (ft)
Pipe
Start End diameter Input Actual At start Node Temperature, °F
4 5 2.5 70 75.3 34.4 (79.37) 160
*Chiller or boiler pressure drop not included.
†Labor and cost units are entered by user as master data for given localities. Cost estimates are not in-
tended to give accurate costs for bidding purposes.
1.3 Hydraulic-Gradient Diagrams
The hydraulic-gradient diagram provides a visual description of the
changes in total pressure in a water system. To date, these diagrams
have been drawn manually; the actual drawing of the hydraulic-
gradient diagram is now being evaluated for conversion to software;
when this is completed, the diagram will appear automatically on the
computer screen after the piping friction calculations are completed.
The hydraulic-gradient diagram has proved to be an invaluable tool
in the development of a water system. It will appear throughout this
book for various types of water systems. Its generation will be ex-
plained in Chap. 3. Clarification should be made between an energy
gradient and the hydraulic gradient of a water system. The energy gra-
2
dient includes the velocity head V /2g, of the water system, while the
hydraulic gradient includes only the static and pressure heads. Velocity
head is usually a number less than 5 ft and is not used to move water
through pipe, as are static and pressure heads. Using the energy gradi-
ent with the velocity head increases the calculations for developing
these diagrams; therefore, the hydraulic gradient is used instead.
1.3.1 Energy and hydraulic gradients
Figure 1.1 describes the difference between the energy gradient and
the hydraulic gradient. This diagram is typical for an open system
Downloaded from Digital Engineering Library @ McGraw-Hill (www.digitalengineeringlibrary.com)
Copyright © 2006 The McGraw-Hill Companies. All rights reserved.
Any use is subject to the Terms of Use as given at the website.