
Page 46 - Handbook of Biomechatronics
P. 46
40 Reva E. Johnson and Jonathon W. Sensinger
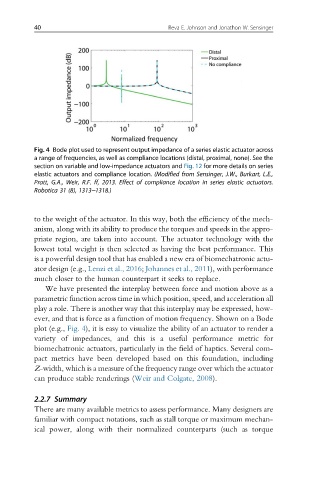
Fig. 4 Bode plot used to represent output impedance of a series elastic actuator across
a range of frequencies, as well as compliance locations (distal, proximal, none). See the
section on variable and low-impedance actuators and Fig. 12 for more details on series
elastic actuators and compliance location. (Modified from Sensinger, J.W., Burkart, L.E.,
Pratt, G.A., Weir, R.F. ff, 2013. Effect of compliance location in series elastic actuators.
Robotica 31 (8), 1313–1318.)
to the weight of the actuator. In this way, both the efficiency of the mech-
anism, along with its ability to produce the torques and speeds in the appro-
priate region, are taken into account. The actuator technology with the
lowest total weight is then selected as having the best performance. This
is a powerful design tool that has enabled a new era of biomechatronic actu-
ator design (e.g., Lenzi et al., 2016; Johannes et al., 2011), with performance
much closer to the human counterpart it seeks to replace.
We have presented the interplay between force and motion above as a
parametric function across time in which position, speed, and acceleration all
play a role. There is another way that this interplay may be expressed, how-
ever, and that is force as a function of motion frequency. Shown on a Bode
plot (e.g., Fig. 4), it is easy to visualize the ability of an actuator to render a
variety of impedances, and this is a useful performance metric for
biomechatronic actuators, particularly in the field of haptics. Several com-
pact metrics have been developed based on this foundation, including
Z-width, which is a measure of the frequency range over which the actuator
can produce stable renderings (Weir and Colgate, 2008).
2.2.7 Summary
There are many available metrics to assess performance. Many designers are
familiar with compact notations, such as stall torque or maximum mechan-
ical power, along with their normalized counterparts (such as torque