
Page 303 - Handbook of Energy Engineering Calculations
P. 303
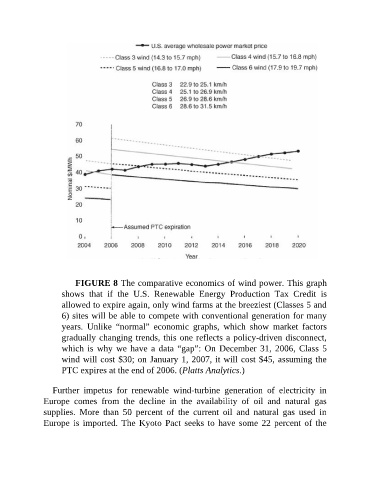
FIGURE 8 The comparative economics of wind power. This graph
                     shows  that  if  the  U.S.  Renewable  Energy  Production  Tax  Credit  is
                     allowed to expire again, only wind farms at the breeziest (Classes 5 and
                     6) sites will be able to compete with conventional generation for many

                     years.  Unlike  “normal”  economic  graphs,  which  show  market  factors
                     gradually changing trends, this one reflects a policy-driven disconnect,
                     which is why we have a data “gap”: On December 31, 2006, Class 5
                     wind will cost $30; on January 1, 2007, it will cost $45, assuming the

                     PTC expires at the end of 2006. (Platts Analytics.)

                  Further  impetus  for  renewable  wind-turbine  generation  of  electricity  in
               Europe  comes  from  the  decline  in  the  availability  of  oil  and  natural  gas
               supplies.  More  than  50  percent  of  the  current  oil  and  natural  gas  used  in
               Europe is imported. The Kyoto Pact seeks to have some 22 percent of the