
Page 245 - Handbook of Gold Exploration and Evaluation
P. 245
216 Handbook of gold exploration and evaluation
achieve significant proportions, if they are derived from a large area of ground
water storage further down in the drainage basin. Such streams may become self-
supporting in the valley system on a seasonal basis.
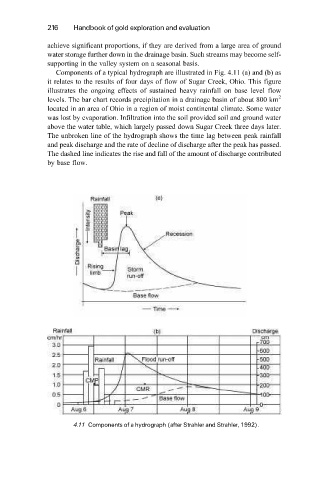
Components of a typical hydrograph are illustrated in Fig. 4.11 (a) and (b) as
it relates to the results of four days of flow of Sugar Creek, Ohio. This figure
illustrates the ongoing effects of sustained heavy rainfall on base level flow
2
levels. The bar chart records precipitation in a drainage basin of about 800 km
located in an area of Ohio in a region of moist continental climate. Some water
was lost by evaporation. Infiltration into the soil provided soil and ground water
above the water table, which largely passed down Sugar Creek three days later.
The unbroken line of the hydrograph shows the time lag between peak rainfall
and peak discharge and the rate of decline of discharge after the peak has passed.
The dashed line indicates the rise and fall of the amount of discharge contributed
by base flow.
4.11 Components of a hydrograph (after Strahler and Strahler, 1992).