
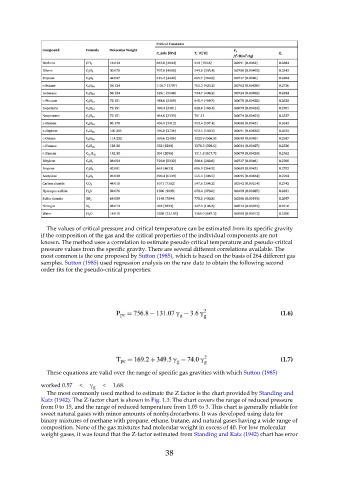
Page 38 - Handbook of Natural Gas Transmission and Processing Principles and Practices
P. 38
The values of critical pressure and critical temperature can be estimated from its specific gravity
               if the composition of the gas and the critical properties of the individual components are not
               known. The method uses a correlation to estimate pseudo-critical temperature and pseudo-critical
               pressure values from the specific gravity. There are several different correlations available. The
               most common is the one proposed by Sutton (1985), which is based on the basis of 264 different gas
               samples. Sutton (1985) used regression analysis on the raw data to obtain the following second
               order fits for the pseudo-critical properties.


                                                                                                    (1.6)


                                                                                                    (1.7)

                 These equations are valid over the range of specific gas gravities with which Sutton (1985)

               worked 0.57    <    γ    <    1.68.
                                  g
                 The most commonly used method to estimate the Z factor is the chart provided by Standing and
               Katz (1942). The Z-factor chart is shown in Fig. 1.3. The chart covers the range of reduced pressure
               from 0 to 15, and the range of reduced temperature from 1.05 to 3. This chart is generally reliable for
               sweet natural gases with minor amounts of nonhydrocarbons. It was developed using data for
               binary mixtures of methane with propane, ethane, butane, and natural gases having a wide range of
               composition. None of the gas mixtures had molecular weight in excess of 40. For low molecular
               weight gases, it was found that the Z-factor estimated from Standing and Katz (1942) chart has error

                                                           38