
Page 310 - Handbook of Properties of Textile and Technical Fibres
P. 310
284 Handbook of Properties of Textile and Technical Fibres
8.4.2 Influence of characterization conditions
During a mechanical test, numerous parameters influence the mechanical properties
which include the following:
• The diameter (cross section) may not be constant along the same fiber within the gauge
length. The Young’s modulus and the strength at break vary with the fiber diameter for
some batches; in this case, the smaller the diameter the greater the stiffness and strength
(Baley, 2002; Duval et al., 2011).
• The effect of length on the failure stress of the fiber is described as depending on its volume.
This is also true for glass or carbon fibers that can be affected by defects located both on
the surface and in the core of the fiber (Poricke and Andersons, 2013; Paramonov and
Andersons, 2006).
• The percentage of water absorbed by the fiber (Baley et al., 2005, 2012; Placet et al., 2011).
• The methods of extraction of the fibers and handling (Lefeuvre et al., 2014b).
• The loading procedure during fiber testing.
• The temperature and humidity during testing and so on.
Moreover, the fibers exhibit transverse defects, such as kink bands caused by a
buckling of the fibrillar edifice (Bos et al., 2002) during mechanical treatments, which
are privileged zones for failure (Baley, 2004). This type of defects is also observed on
polymeric fibers (polyethylene, aramid) under compression stresses.
8.4.3 Analysis of tensile behavior of elementary flax fibers
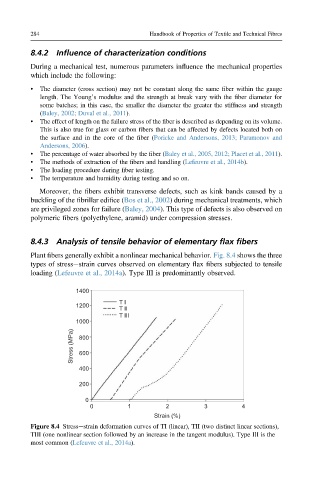
Plant fibers generally exhibit a nonlinear mechanical behavior. Fig. 8.4 shows the three
types of stressestrain curves observed on elementary flax fibers subjected to tensile
loading (Lefeuvre et al., 2014a). Type III is predominantly observed.
1400
T I
1200
T II
T III
1000
Stress (MPa) 800
600
400
200
0
0 1 2 3 4
Strain (%)
Figure 8.4 Stressestrain deformation curves of TI (linear), TII (two distinct linear sections),
TIII (one nonlinear section followed by an increase in the tangent modulus). Type III is the
most common (Lefeuvre et al., 2014a).