
Page 249 - Hybrid-Renewable Energy Systems in Microgrids
P. 249
226 Hybrid-Renewable Energy Systems in Microgrids
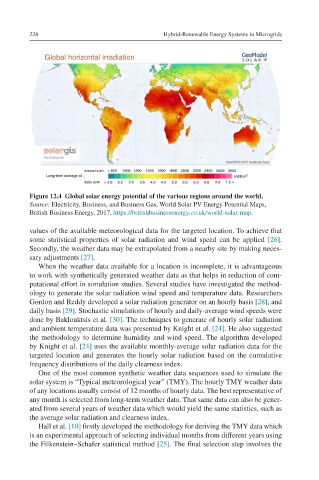
Figure 12.4 Global solar energy potential of the various regions around the world.
Source: Electricity, Business, and Business Gas, World Solar PV Energy Potential Maps,
British Business Energy, 2017, https://britishbusinessenergy.co.uk/world-solar-map.
values of the available meteorological data for the targeted location. To achieve that
some statistical properties of solar radiation and wind speed can be applied [26].
Secondly, the weather data may be extrapolated from a nearby site by making neces-
sary adjustments [27].
When the weather data available for a location is incomplete, it is advantageous
to work with synthetically generated weather data as that helps in reduction of com-
putational effort in simulation studies. Several studies have investigated the method-
ology to generate the solar radiation wind speed and temperature data. Researchers
Gordon and Reddy developed a solar radiation generator on an hourly basis [28], and
daily basis [29]. Stochastic simulations of hourly and daily-average wind speeds were
done by Baklouktsis et al. [30]. The techniques to generate of hourly solar radiation
and ambient temperature data was presented by Knight et al. [24]. He also suggested
the methodology to determine humidity and wind speed. The algorithm developed
by Knight et al. [24] uses the available monthly-average solar radiation data for the
targeted location and generates the hourly solar radiation based on the cumulative
frequency distributions of the daily clearness index.
One of the most common synthetic weather data sequences used to simulate the
solar system is “Typical meteorological year” (TMY). The hourly TMY weather data
of any locations usually consist of 12 months of hourly data. The best representative of
any month is selected from long-term weather data. That same data can also be gener-
ated from several years of weather data which would yield the same statistics, such as
the average solar radiation and clearness index.
Hall et al. [10] firstly developed the methodology for deriving the TMY data which
is an experimental approach of selecting individual months from different years using
the Filkenstein–Schafer statistical method [25]. The final selection step involves the