
Page 177 - Hydrocarbon
P. 177
164 Data Interpretation
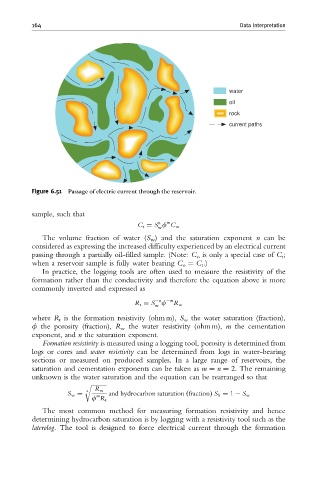
water
oil
rock
current paths
Figure 6.51 Passage of electric current through the reservoir.
sample, such that
n m
C t ¼ S f C w
w
The volume fraction of water (S w ) and the saturation exponent n can be
considered as expressing the increased difficulty experienced by an electrical current
passing through a partially oil-filled sample. (Note: C o is only a special case of C t ;
when a reservoir sample is fully water bearing C o ¼ C t .)
In practice, the logging tools are often used to measure the resistivity of the
formation rather than the conductivity and therefore the equation above is more
commonly inverted and expressed as
n
R t ¼ S f m
w R w
where R t is the formation resistivity (ohm m), S w the water saturation (fraction),
f the porosity (fraction), R w the water resistivity (ohm m), m the cementation
exponent, and n the saturation exponent.
Formation resistivity is measured using a logging tool, porosity is determined from
logs or cores and water resistivity can be determined from logs in water-bearing
sections or measured on produced samples. In a large range of reservoirs, the
saturation and cementation exponents can be taken as m ¼ n ¼ 2. The remaining
unknown is the water saturation and the equation can be rearranged so that
r ffiffiffiffiffiffiffiffiffiffiffi
R w
n
S w ¼ m and hydrocarbon saturation ðfractionÞ S h ¼ 1 S w
f R t
The most common method for measuring formation resistivity and hence
determining hydrocarbon saturation is by logging with a resistivity tool such as the
laterolog. The tool is designed to force electrical current through the formation