
Page 220 - Hydrocarbon
P. 220
Reservoir Dynamic Behaviour 207
gas
gas
separator
compression
compression
G
external
external
O gas supply
gas supply
produced
external pump oil
water supply W to sales
(e.g. seawater) produced
water
secondary
secondary
gas cap
gas cap
Gas
Injection
OWC Well
Producing
Well
Water Injection Well
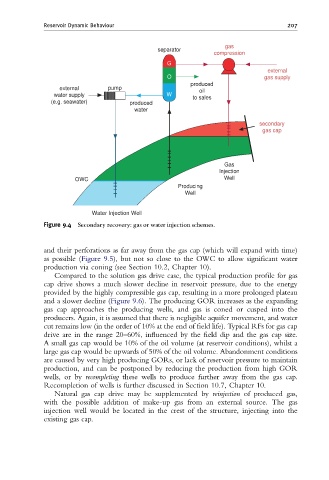
Figure 9.4 Secondary recovery: gas or water injection schemes.
and their perforations as far away from the gas cap (which will expand with time)
as possible (Figure 9.5), but not so close to the OWC to allow significant water
production via coning (see Section 10.2, Chapter 10).
Compared to the solution gas drive case, the typical production profile for gas
cap drive shows a much slower decline in reservoir pressure, due to the energy
provided by the highly compressible gas cap, resulting in a more prolonged plateau
and a slower decline (Figure 9.6). The producing GOR increases as the expanding
gas cap approaches the producing wells, and gas is coned or cusped into the
producers. Again, it is assumed that there is negligible aquifer movement, and water
cut remains low (in the order of 10% at the end of field life). Typical RFs for gas cap
drive are in the range 20–60%, influenced by the field dip and the gas cap size.
A small gas cap would be 10% of the oil volume (at reservoir conditions), whilst a
large gas cap would be upwards of 50% of the oil volume. Abandonment conditions
are caused by very high producing GORs, or lack of reservoir pressure to maintain
production, and can be postponed by reducing the production from high GOR
wells, or by recompleting these wells to produce further away from the gas cap.
Recompletion of wells is further discussed in Section 10.7, Chapter 10.
Natural gas cap drive may be supplemented by reinjection of produced gas,
with the possible addition of make-up gas from an external source. The gas
injection well would be located in the crest of the structure, injecting into the
existing gas cap.