
Page 238 - Hydrocarbon
P. 238
Reservoir Dynamic Behaviour 225
Oil Rate (b/d)
(B) (A)
(C) plateau
decline
build-up
Time
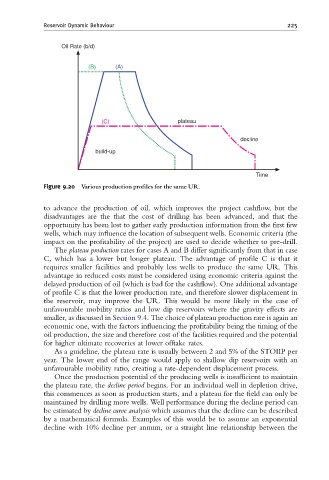
Figure 9.20 Various production pro¢les for the same UR.
to advance the production of oil, which improves the project cashflow, but the
disadvantages are the that the cost of drilling has been advanced, and that the
opportunity has been lost to gather early production information from the first few
wells, which may influence the location of subsequent wells. Economic criteria (the
impact on the profitability of the project) are used to decide whether to pre-drill.
The plateau production rates for cases A and B differ significantly from that in case
C, which has a lower but longer plateau. The advantage of profile C is that it
requires smaller facilities and probably less wells to produce the same UR. This
advantage in reduced costs must be considered using economic criteria against the
delayed production of oil (which is bad for the cashflow). One additional advantage
of profile C is that the lower production rate, and therefore slower displacement in
the reservoir, may improve the UR. This would be more likely in the case of
unfavourable mobility ratios and low dip reservoirs where the gravity effects are
smaller, as discussed in Section 9.4. The choice of plateau production rate is again an
economic one, with the factors influencing the profitability being the timing of the
oil production, the size and therefore cost of the facilities required and the potential
for higher ultimate recoveries at lower offtake rates.
As a guideline, the plateau rate is usually between 2 and 5% of the STOIIP per
year. The lower end of the range would apply to shallow dip reservoirs with an
unfavourable mobility ratio, creating a rate-dependent displacement process.
Once the production potential of the producing wells is insufficient to maintain
the plateau rate, the decline period begins. For an individual well in depletion drive,
this commences as soon as production starts, and a plateau for the field can only be
maintained by drilling more wells. Well performance during the decline period can
be estimated by decline curve analysis which assumes that the decline can be described
by a mathematical formula. Examples of this would be to assume an exponential
decline with 10% decline per annum, or a straight line relationship between the