
Page 225 - Hydrocarbon Exploration and Production Second Edition
P. 225
212 Gas Reservoirs
customer receives has a predictable calorific value and hence predictable burning
characteristics. If the gas becomes lean, less energy is released, and if the gas
becomes too rich there is a risk that the gas burners ‘flame out’. Water and
hydrocarbon dew points (the pressure and temperature at which liquids start to
drop out of the gas) are specified to ensure that over the range of temperature
and pressure at which the gas is handled by the customer, no liquids will drop out
(these could cause possible slugging, corrosion and/or hydrate formation).
H 2 S is undesirable because of its toxicity and corrosive properties. CO 2 can
cause corrosion in the presence of water, and N 2 simply reduces the calorific value
of the gas as it is inert.
9.3.2. Gas sales profiles; influence of contracts
If the gas purchaser is a company which distributes gas to domestic and industrial
end users, he typically wants the producer to provide
a guaranteed minimum quantity of gas for as long a duration as possible (for ease
of planning and the comfort of being able to guarantee supply to the end user) and
peaks in production when required (e.g. when the weather unexpectedly turns
cold).
The better the producer can meet these two requirements, the higher the price
paid by the purchaser is likely to be.
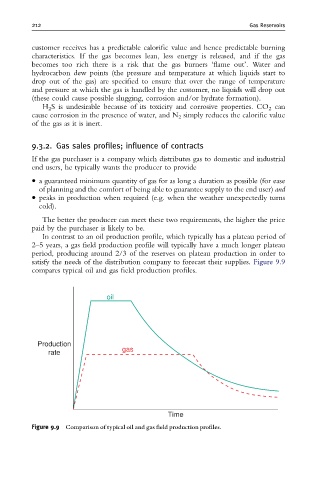
In contrast to an oil production profile, which typically has a plateau period of
2–5 years, a gas field production profile will typically have a much longer plateau
period, producing around 2/3 of the reserves on plateau production in order to
satisfy the needs of the distribution company to forecast their supplies. Figure 9.9
compares typical oil and gas field production profiles.
oil
oil
Production
gas
rate
Time
Figure 9.9 Comparison of typical oil and gas ¢eld production pro¢les.