
Page 294 - Hydrocarbon Exploration and Production Second Edition
P. 294
Surface Facilities 281
11.1.3.1. Pressure reduction
Gas is sometimes produced at very high pressures which have to be reduced for
efficient processing and to reduce the weight and cost of the process facilities. The
first pressure reduction is normally made across a choke before the well fluid enters
the primary oil–gas separator.
Note that primary separation has already been described in Section 11.1.2.
11.1.3.2. Gas dehydration
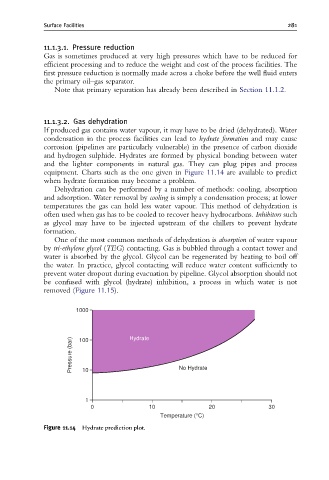
If produced gas contains water vapour, it may have to be dried (dehydrated). Water
condensation in the process facilities can lead to hydrate formation and may cause
corrosion (pipelines are particularly vulnerable) in the presence of carbon dioxide
and hydrogen sulphide. Hydrates are formed by physical bonding between water
and the lighter components in natural gas. They can plug pipes and process
equipment. Charts such as the one given in Figure 11.14 are available to predict
when hydrate formation may become a problem.
Dehydration can be performed by a number of methods: cooling, absorption
and adsorption. Water removal by cooling is simply a condensation process; at lower
temperatures the gas can hold less water vapour. This method of dehydration is
often used when gas has to be cooled to recover heavy hydrocarbons. Inhibitors such
as glycol may have to be injected upstream of the chillers to prevent hydrate
formation.
One of the most common methods of dehydration is absorption of water vapour
by tri-ethylene glycol (TEG) contacting. Gas is bubbled through a contact tower and
water is absorbed by the glycol. Glycol can be regenerated by heating to boil off
the water. In practice, glycol contacting will reduce water content sufficiently to
prevent water dropout during evacuation by pipeline. Glycol absorption should not
be confused with glycol (hydrate) inhibition, a process in which water is not
removed (Figure 11.15).
1000
Pressure (bar) 100 Hydrate No Hydrate
10
1
0 10 20 30
Temperature (°C)
Figure 11.14 Hydrate prediction plot.