
Page 210 - Illustrated Pocket Dictionary of Chromatography
P. 210
214 WINDOW DIAGRAM
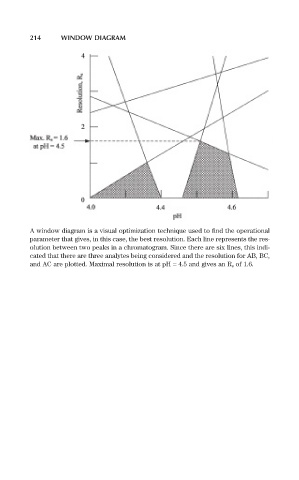
A window diagram is a visual optimization technique used to find the operational
parameter that gives, in this case, the best resolution. Each line represents the res-
olution between two peaks in a chromatogram. Since there are six lines, this indi-
cated that there are three analytes being considered and the resolution for AB, BC,
and AC are plotted. Maximal resolution is at pH = 4.5 and gives an R s of 1.6.