Page 339 - Materials Chemistry, Second Edition
P. 339

L1644_C08.fm  Page 307  Tuesday, October 21, 2003  3:03 PM


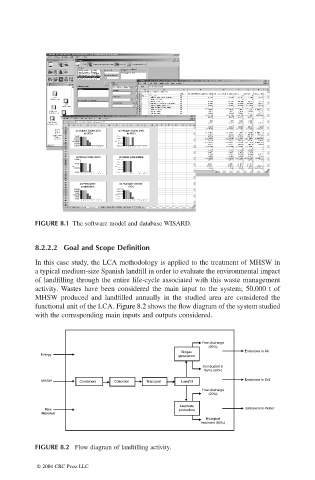
                             FIGURE 8.1 The software model and database WISARD.


                             8.2.2.2  Goal and Scope Definition
                             In this case study, the LCA methodology is applied to the treatment of MHSW in
                             a typical medium-size Spanish landfill in order to evaluate the environmental impact
                             of landfilling through the entire life-cycle associated with this waste management
                             activity. Wastes have been considered the main input to the system; 50,000 t of
                             MHSW produced and landfilled annually in the studied area are considered the
                             functional unit of the LCA. Figure 8.2 shows the flow diagram of the system studied
                             with the corresponding main inputs and outputs considered.


                                                                          Free discharge
                                                                            (50%)
                                                                     Biogas           Emissions to Air
                              Energy                                generation
                                                                           Combusted in
                                                                           flame (50%)
                              MHSW        Containers                 Collection      Transport  Landfill  Emissions to Soil
                                                                          Free discharge
                                                                            (20%)
                                                                    Leachate
                               Raw                                  production        Emissions to Water
                              Materials
                                                                           Biological
                                                                          treatment (80%)

                             FIGURE 8.2  Flow diagram of landfilling activity.

                             © 2004 CRC Press LLC
   334   335   336   337   338   339   340   341   342   343   344