
Page 108 - Intelligent Digital Oil And Gas Fields
P. 108
Data Filtering and Conditioning 77
Cleansing Conditioning
Spike correction Event state and
Freeze correction condition
Gap interpolation detection
Physics check
High frequency
sensor Advanced Down sampling:
steaming data appropriate
validation: frequency
Out of range
Bad instrument
Statistical
Model validation:
summary
First principles
Artificial
intelligence
Reconciliation:
Multiple source
correction
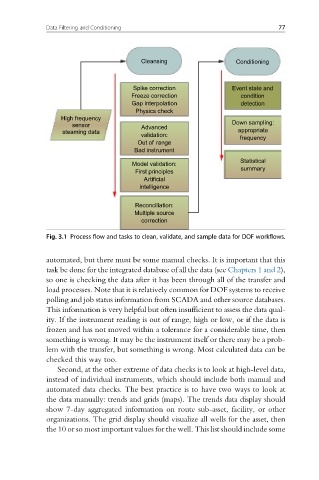
Fig. 3.1 Process flow and tasks to clean, validate, and sample data for DOF workflows.
automated, but there must be some manual checks. It is important that this
task be done for the integrated database of all the data (see Chapters 1 and 2),
so one is checking the data after it has been through all of the transfer and
load processes. Note that it is relatively common for DOF systems to receive
polling and job status information from SCADA and other source databases.
This information is very helpful but often insufficient to assess the data qual-
ity. If the instrument reading is out of range, high or low, or if the data is
frozen and has not moved within a tolerance for a considerable time, then
something is wrong. It may be the instrument itself or there may be a prob-
lem with the transfer, but something is wrong. Most calculated data can be
checked this way too.
Second, at the other extreme of data checks is to look at high-level data,
instead of individual instruments, which should include both manual and
automated data checks. The best practice is to have two ways to look at
the data manually: trends and grids (maps). The trends data display should
show 7-day aggregated information on route sub-asset, facility, or other
organizations. The grid display should visualize all wells for the asset, then
the 10 or so most important values for the well. This list should include some