
Page 96 - Intro to Space Sciences Spacecraft Applications
P. 96
03
Spacecraft Environment
where K = Boltzman’s constant, h = Planck‘s constant, and the other
terms are as described previously.
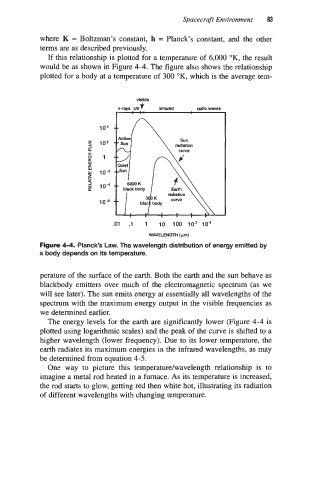
If this relationship is plotted for a temperature of 6,000 OK, the result
would be as shown in Figure 4-4. The figure also shows the relationship
plotted for a body at a temperature of 300 OK, which is the average tem-
104
102
1
io-.
106
.oi .I 1 io 100 io3 io4
WAVELENGTH (pm)
Figure 4-4. Planck’s Law. The wavelength distribution of energy emitted by
a body depends on its temperature.
perature of the surface of the earth. Both the earth and the sun behave as
blackbody emitters over much of the electromagnetic spectrum (as we
will see later). The sun emits energy at essentially all wavelengths of the
spectrum with the maximum energy output in the visible frequencies as
we determined earlier.
The energy levels for the earth are significantly lower (Figure 4-4 is
plotted using logarithmic scales) and the peak of the curve is shifted to a
higher wavelength (lower frequency). Due to its lower temperature, the
earth radiates its maximum energies in the infrared wavelengths, as may
be determined from equation 4-5.
One way to picture this temperature/wavelength relationship is to
imagine a metal rod heated in a furnace. As its temperature is increased,
the rod starts to glow, getting red then white hot, illustrating its radiation
of different wavelengths with changing temperature.