
Page 233 - Introduction to Continuum Mechanics
P. 233
218 The Elastic Solid
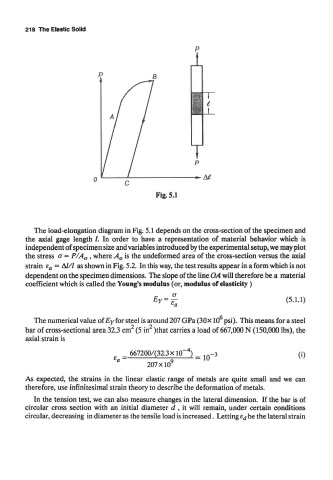
Fig. 5.1
The load-elongation diagram in Fig. 5.1 depends on the cross-section of the specimen and
the axial gage length /. In order to have a representation of material behavior which is
independent of specimen size and variables introduced by the experimental setup, we may plot
the stress o = P/A 0 , where A 0 is the undeformed area of the cross-section versus the axial
strain e a = A/// as shown in Fig. 5.2. In this way, the test results appear in a form which is not
dependent on the specimen dimensions. The slope of the line OA will therefore be a material
coefficient which is called the Young's modulus (or, modulus of elasticity)
6
The numerical value of Ey for steel is around 207 GPa (30 x 10 psi). This means for a steel
bar of cross-sectional area 32.3 cm (5 in )that carries a load of 667,000 N (150,000 Ibs), the
axial strain is
As expected, the strains in the linear elastic range of metals are quite small and we can
therefore, use infinitesimal strain theory to describe the deformation of metals.
In the tension test, we can also measure changes in the lateral dimension. If the bar is of
circular cross section with an initial diameter d , it will remain, under certain conditions
circular, decreasing in diameter as the tensile load is increased. Letting e^be the lateral strain