
Page 212 - Introduction to Naval Architecture
P. 212
198 RESISTANCE
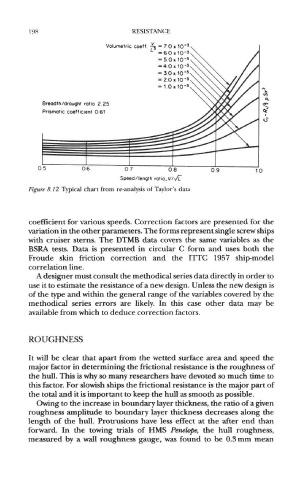
Figure 8.12 Typical chart from re-analysis of Taylor's data
coefficient for various speeds. Correction factors are presented for the
variation in the other parameters. The forms represent single screw ships
with cruiser sterns. The DTMB data covers the same variables as the
BSRA tests. Data is presented in circular C form and uses both the
Froude skin friction correction and the ITTC 1957 ship-model
correlation line.
A designer must consult the methodical series data directly in order to
use it to estimate the resistance of a new design. Unless the new design is
of the type and within the general range of the variables covered by the
methodical series errors are likely. In this case other data may be
available from which to deduce correction factors.
ROUGHNESS
It will be clear that apart from the wetted surface area and speed the
major factor in determining the frictional resistance is the roughness of
the hull. This is why so many researchers have devoted so much time to
this factor. For slowish ships the frictional resistance is the major part of
the total and it is important to keep the hull as smooth as possible.
Owing to the increase in boundary layer thickness, the ratio of a given
roughness amplitude to boundary layer thickness decreases along the
length of the hull. Protrusions have less effect at the after end than
forward. In the towing trials of HMS Penelope, the hull roughness,
measured by a wall roughness gauge, was found to be 0.3mm mean