
Page 73 - Introduction to Naval Architecture
P. 73
60 FLOTATION AND STABILITY
Figure 4.22 Atwood's formula
Curves of statical stability
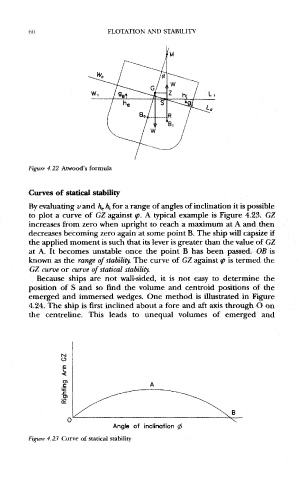
By evaluating v and h e hj for a range of angles of inclination it is possible
to plot a curve of GZ against <p. A typical example is Figure 4.23. GZ
increases from zero when upright to reach a maximum at A and then
decreases becoming zero again at some point B. The ship will capsize if
the applied moment is such that its lever is greater than the value of GZ
at A. It becomes unstable once the point B has been passed. OB is
known as the range of stability. The curve of GZ against (p is termed the
GZ curve or curve of statical stability
Because ships are not wall-sided, it is not easy to determine the
position of S and so find the volume and centroid positions of the
emerged and immersed wedges. One method is illustrated in Figure
4.24, The ship is first inclined about a fore and aft axis through O on
the centreline. This leads to unequal volumes of emerged and
Angle of inclination 0
Figure 4,23 Curve of statical stability