
Page 42 - Materials Chemistry, Second Edition
P. 42
Life cycle assessment in practice
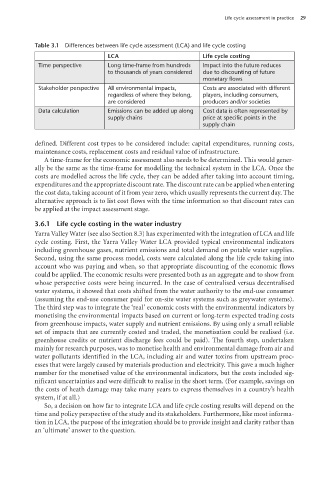
Table 3.1 Differences between life cycle assessment (LCA) and life cycle costing 29
LCA Life cycle costing
Time perspective Long time-frame from hundreds Impact into the future reduces
to thousands of years considered due to discounting of future
monetary flows
Stakeholder perspective All environmental impacts, Costs are associated with different
regardless of where they belong, players, including consumers,
are considered producers and/or societies
Data calculation Emissions can be added up along Cost data is often represented by
supply chains price at specific points in the
supply chain
defined. Different cost types to be considered include: capital expenditures, running costs,
maintenance costs, replacement costs and residual value of infrastructure.
A time-frame for the economic assessment also needs to be determined. This would gener-
ally be the same as the time-frame for modelling the technical system in the LCA. Once the
costs are modelled across the life cycle, they can be added after taking into account timing,
expenditures and the appropriate discount rate. The discount rate can be applied when entering
the cost data, taking account of it from year zero, which usually represents the current day. The
alternative approach is to list cost flows with the time information so that discount rates can
be applied at the impact assessment stage.
3.6.1 Life cycle costing in the water industry
Yarra Valley Water (see also Section 8.3) has experimented with the integration of LCA and life
cycle costing. First, the Yarra Valley Water LCA provided typical environmental indicators
including greenhouse gases, nutrient emissions and total demand on potable water supplies.
Second, using the same process model, costs were calculated along the life cycle taking into
account who was paying and when, so that appropriate discounting of the economic flows
could be applied. The economic results were presented both as an aggregate and to show from
whose perspective costs were being incurred. In the case of centralised versus decentralised
water systems, it showed that costs shifted from the water authority to the end-use consumer
(assuming the end-use consumer paid for on-site water systems such as greywater systems).
The third step was to integrate the ‘real’ economic costs with the environmental indicators by
monetising the environmental impacts based on current or long-term expected trading costs
from greenhouse impacts, water supply and nutrient emissions. By using only a small reliable
set of impacts that are currently costed and traded, the monetisation could be realised (i.e.
greenhouse credits or nutrient discharge fees could be paid). The fourth step, undertaken
mainly for research purposes, was to monetise health and environmental damage from air and
water pollutants identified in the LCA, including air and water toxins from upstream proc-
esses that were largely caused by materials production and electricity. This gave a much higher
number for the monetised value of the environmental indicators, but the costs included sig-
nificant uncertainties and were difficult to realise in the short term. (For example, savings on
the costs of heath damage may take many years to express themselves in a country’s health
system, if at all.)
So, a decision on how far to integrate LCA and life cycle costing results will depend on the
time and policy perspective of the study and its stakeholders. Furthermore, like most informa-
tion in LCA, the purpose of the integration should be to provide insight and clarity rather than
an ‘ultimate’ answer to the question.
100804•Life Cycle Assessment 5pp.indd 29 17/02/09 12:46:15 PM