
Page 90 - Materials Chemistry, Second Edition
P. 90
72 LIFE CYCLE ASSESSMENT HANDBOOK
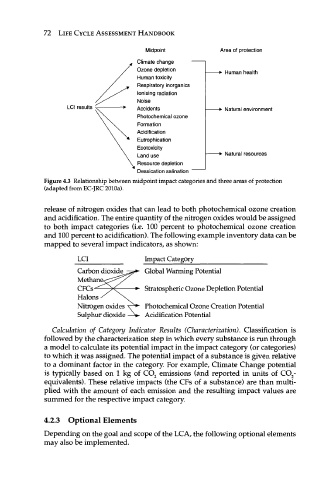
Midpoint Area of protection
Climate change —
Ozone depletion -> Human health
Human toxicity
Respiratory inorganics
Ionising radiation
Noise
LCI results Accidents -► Natural environment
Photochemical ozone
Formation
Acidification
Eutrophication
Ecotoxicity
Land use -► Natural resources
Resource depletion
Dessication salination
Figure 4.3 Relationship between midpoint impact categories and three areas of protection
(adapted from EC-JRC 2010a).
release of nitrogen oxides that can lead to both photochemical ozone creation
and acidification. The entire quantity of the nitrogen oxides would be assigned
to both impact categories (i.e. 100 percent to photochemical ozone creation
and 100 percent to acidification). The following example inventory data can be
mapped to several impact indicators, as shown:
LCI Impact Category
Carbon dioxide Global Warming Potential
Methane<
CFCs- ► Stratospheric Ozone Depletion Potential
Halons
Nitrogen oxides Photochemical Ozone Creation Potential
Sulphur dioxide - ^ Acidification Potential
Calculation of Category Indicator Results (Characterization). Classification is
followed by the characterization step in which every substance is run through
a model to calculate its potential impact in the impact category (or categories)
to which it was assigned. The potential impact of a substance is given relative
to a dominant factor in the category. For example, Climate Change potential
is typically based on 1 kg of C0 2 emissions (and reported in units of C0 2 -
equivalents). These relative impacts (the CFs of a substance) are than multi-
plied with the amount of each emission and the resulting impact values are
summed for the respective impact category.
4.2.3 Optional Elements
Depending on the goal and scope of the LCA, the following optional elements
may also be implemented.