
Page 133 - Materials Chemistry, Second Edition
P. 133
6.3 Green building materials 129
We carried out environmental impact characterization and normalization on the midpoint
level (Strauss et al., 2006; Bueno et al., 2016), to compare the contribution of building materials
to the total global impacts in different impact categories. In normalization, the characterized
results of each impact category are divided by a selected reference value, which brings all the
results to the same scale. Such normalization facilitates the interpretation of the results and
helps us link the relative contributions of each building material to each type of environmen-
tal impact.
6.3.1.2 Results
Existing researches show that around the world, 20% of the building life cycle energy con-
sumption and environmental impacts are from the building materials (Adalberth, 1997).
The environmental impact of building materialization on the environment includes 15 envi-
ronmental impact categories such as climate change, surface acidification, the formation of
photochemical oxidants, particulates, ozone depletion, ionizing radiation, eutrophication
of fresh water, ocean eutrophication, human toxicity, freshwater, marine ecological toxicity,
land ecological toxicity, fossil fuel consumption, and the loss of metal (Huang et al., 2017b).
The main impacts of the built environment are water consumption, metal pollution, and
global warming (Minho et al., 2015; Li et al., 2016).
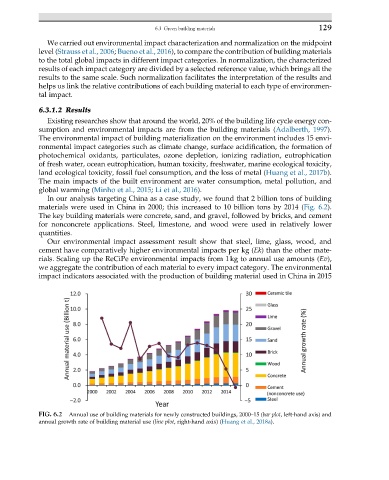
In our analysis targeting China as a case study, we found that 2 billion tons of building
materials were used in China in 2000; this increased to 10 billion tons by 2014 (Fig. 6.2).
The key building materials were concrete, sand, and gravel, followed by bricks, and cement
for nonconcrete applications. Steel, limestone, and wood were used in relatively lower
quantities.
Our environmental impact assessment result show that steel, lime, glass, wood, and
cement have comparatively higher environmental impacts per kg (Ek) than the other mate-
rials. Scaling up the ReCiPe environmental impacts from 1kg to annual use amounts (Ev),
we aggregate the contribution of each material to every impact category. The environmental
impact indicators associated with the production of building material used in China in 2015
FIG. 6.2 Annual use of building materials for newly constructed buildings, 2000–15 (bar plot, left-hand axis) and
annual growth rate of building material use (line plot, right-hand axis) (Huang et al., 2018a).