
Page 231 - Materials Chemistry, Second Edition
P. 231
11.2 Life cycle environmental indicators 229
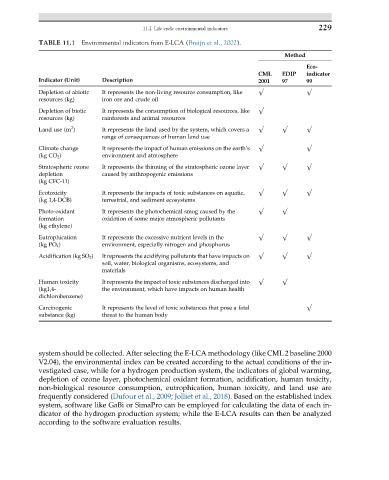
TABLE 11.1 Environmental indicators from E-LCA (Bruijn et al., 2002).
Method
Eco-
CML EDIP indicator
Indicator (Unit) Description 2001 97 99
Depletion of abiotic It represents the non-living resource consumption, like √ √
resources (kg) iron ore and crude oil
Depletion of biotic It represents the consumption of biological resources, like √
resources (kg) rainforests and animal resources
2
Land use (m ) It represents the land used by the system, which covers a √ √ √
range of consequences of human land use
Climate change It represents the impact of human emissions on the earth’s √ √
(kg CO 2 ) environment and atmosphere
Stratospheric ozone It represents the thinning of the stratospheric ozone layer √ √ √
depletion caused by anthropogenic emissions
(kg CFC-11)
Ecotoxicity It represents the impacts of toxic substances on aquatic, √ √ √
(kg 1,4-DCB) terrestrial, and sediment ecosystems
Photo-oxidant It represents the photochemical smog caused by the √ √
formation oxidation of some major atmospheric pollutants
(kg ethylene)
Eutrophication It represents the excessive nutrient levels in the √ √ √
(kg PO 4 ) environment, especially nitrogen and phosphorus
Acidification (kg SO 2 ) It represents the acidifying pollutants that have impacts on √ √ √
soil, water, biological organisms, ecosystems, and
materials
Human toxicity It represents the impact of toxic substances discharged into √ √
(kg1,4- the environment, which have impacts on human health
dichlorobenzene)
Carcinogenic It represents the level of toxic substances that pose a fatal √
substance (kg) threat to the human body
system should be collected. After selecting the E-LCA methodology (like CML 2 baseline 2000
V2.04), the environmental index can be created according to the actual conditions of the in-
vestigated case, while for a hydrogen production system, the indicators of global warming,
depletion of ozone layer, photochemical oxidant formation, acidification, human toxicity,
non-biological resource consumption, eutrophication, human toxicity, and land use are
frequently considered (Dufour et al., 2009; Jolliet et al., 2018). Based on the established index
system, software like GaBi or SimaPro can be employed for calculating the data of each in-
dicator of the hydrogen production system; while the E-LCA results can then be analyzed
according to the software evaluation results.