
Page 237 - Materials Chemistry, Second Edition
P. 237
11.3 Life cycle economic indicators 235
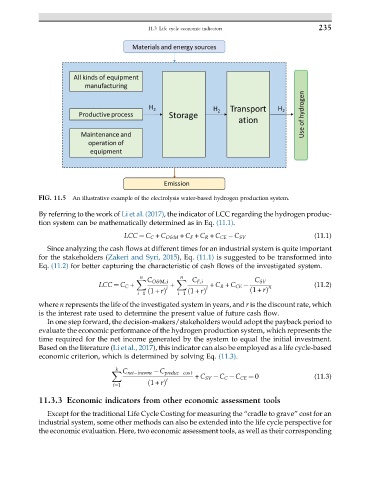
FIG. 11.5 An illustrative example of the electrolysis water-based hydrogen production system.
By referring to the work of Li et al. (2017), the indicator of LCC regarding the hydrogen produc-
tion system can be mathematically determined as in Eq. (11.1).
LCC ¼ C C + C O&M + C F + C R + C CE C SV (11.1)
Since analyzing the cash flows at different times for an industrial system is quite important
for the stakeholders (Zakeri and Syri, 2015), Eq. (11.1) is suggested to be transformed into
Eq. (11.2) for better capturing the characteristic of cash flows of the investigated system.
n n
C O&M,i C F,i C SV
X X
LCC ¼ C C + + + C R + C CE n (11.2)
i i
i¼1 ð 1+ rÞ i¼1 ð 1+ rÞ ð 1+ rÞ
where n represents the life of the investigated system in years, and r is the discount rate, which
is the interest rate used to determine the present value of future cash flow.
In one step forward, the decision-makers/stakeholders would adopt the payback period to
evaluate the economic performance of the hydrogen production system, which represents the
time required for the net income generated by the system to equal the initial investment.
Based on the literature (Li et al., 2017), this indicator can also be employed as a life cycle-based
economic criterion, which is determined by solving Eq. (11.3).
k
X C net income C produc cost
+ C SV C C C CE ¼ 0 (11.3)
i
i¼1 ð 1+ rÞ
11.3.3 Economic indicators from other economic assessment tools
Except for the traditional Life Cycle Costing for measuring the “cradle to grave” cost for an
industrial system, some other methods can also be extended into the life cycle perspective for
the economic evaluation. Here, two economic assessment tools, as well as their corresponding