
Page 244 - Materials Chemistry, Second Edition
P. 244
242 11. A composite life cycle sustainability index for sustainability prioritization of industrial systems
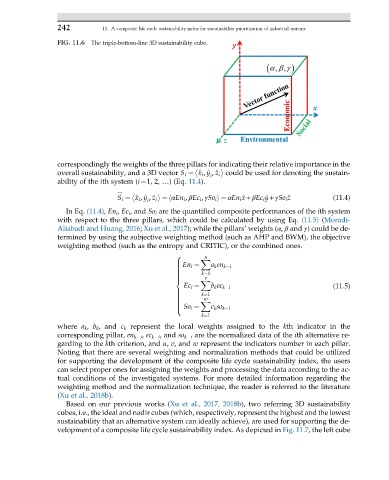
FIG. 11.6 The triple-bottom-line 3D sustainability cube.
correspondingly the weights of the three pillars for indicating their relative importance in the
!
overall sustainability, and a 3D vector S i ¼ ^ x i , ^ y , ^ z i could be used for denoting the sustain-
i
ability of the ith system (i¼1, 2, …) (Eq. 11.4).
!
S i ¼ ^ x i , ^ y , ^ z i ¼ αEn i , βEc i , γSo i i ¼ αEn i ^ x + βEc i ^ y + γSo i ^ z (11.4)
h
i
In Eq. (11.4), En i , Ec i , and So i are the quantified composite performances of the ith system
with respect to the three pillars, which could be calculated by using Eq. (11.5) (Moradi-
Aliabadi and Huang, 2016; Xu et al., 2017); while the pillars’ weights (α, β and γ) could be de-
termined by using the subjective weighting method (such as AHP and BWM), the objective
weighting method (such as the entropy and CRITIC), or the combined ones.
8 u
X
>
> En i ¼ a k en k i
>
>
k¼1
>
>
>
> v
<
X
Ec i ¼ b k ec k i (11.5)
k¼1
>
>
>
w
>
>
X
>
So i ¼
>
> c k so k i
:
k¼1
where a k , b k ,and c k represent the local weights assigned to the kth indicator in the
corresponding pillar, en k i , ec k i , and so k i are the normalized data of the ith alternative re-
garding to the kth criterion, and u, v, and w represent the indicators number in each pillar.
Noting that there are several weighting and normalization methods that could be utilized
for supporting the development of the composite life cycle sustainability index, the users
can select proper ones for assigning the weights and processing the data according to the ac-
tual conditions of the investigated systems. For more detailed information regarding the
weighting method and the normalization technique, the reader is referred to the literature
(Xu et al., 2018b).
Based on our previous works (Xu et al., 2017, 2018b), two referring 3D sustainability
cubes, i.e., the ideal and nadir cubes (which, respectively, represent the highest and the lowest
sustainability that an alternative system can ideally achieve), are used for supporting the de-
velopment of a composite life cycle sustainability index. As depicted in Fig. 11.7, the left cube