Page 149 - Lindens Handbook of Batteries
P. 149

6.2        PRINCIPLES OF OPERATION

                                 100
                                                                                           Model
                                  90                                                       Data
                                  80
                                Discharge capacity (Ah)  70


                                  60
                                  50
                                                                   Current at 0.05 C rate
                                                                                      1
                                                      Discharge time =
                                  40
                                                                     Discharge current  F  0.05
                                  30
                                  20
                                    0     50    100   150   200   250   300    350   400   450   500
                                                            Discharge current (A)
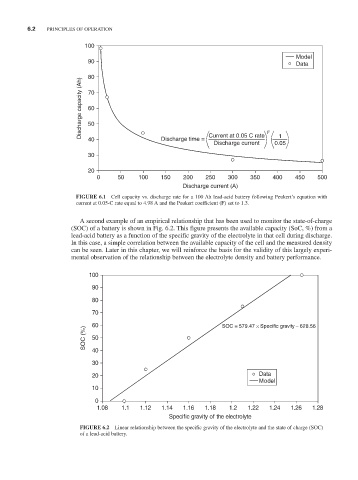
                               FiguRE 6.1  Cell capacity vs. discharge rate for a 100 Ah lead-acid battery following Peukert’s equation with
                               current at 0.05-C rate equal to 4.98 A and the Peukert coefficient (F) set to 1.3.

                                A second example of an empirical relationship that has been used to monitor the state-of-charge
                             (SOC) of a battery is shown in Fig. 6.2. This figure presents the available capacity (SoC, %) from a
                             lead-acid battery as a function of the specific gravity of the electrolyte in that cell during discharge.
                             In this case, a simple correlation between the available capacity of the cell and the measured density
                             can be seen. Later in this chapter, we will reinforce the basis for the validity of this largely experi-
                             mental observation of the relationship between the electrolyte density and battery performance.

                                  100

                                   90
                                   80
                                   70
                                   60                                  SOC = 579.47 × Specific gravity – 628.56
                                 SOC (%)  50

                                   40
                                   30

                                   20                                            Data
                                                                                 Model
                                   10
                                    0
                                    1.08   1.1  1.12  1.14  1.16  1.18   1.2  1.22  1.24  1.26  1.28
                                                        Specific gravity of the electrolyte
                                FiguRE 6.2  Linear relationship between the specific gravity of the electrolyte and the state of charge (SOC)
                                of a lead-acid battery.
   144   145   146   147   148   149   150   151   152   153   154