
Page 150 - Lindens Handbook of Batteries
P. 150
MATHEMATICAL MODELING OF BATTERIES 6.3
Due to the success of Peukert’s equation, investigators started to determine what causes the
capacity of the cell to drop and why the relationship between the discharge rate and the available
capacity of the battery follows the relationship shown in Fig. 6.1.
One early step toward understanding limitations in battery performance was to quantify the loss
in efficiency of the battery compared to theoretical expectations and to attribute such losses to dif-
ferent parts of the cells. The limitations within the cell were categorized into those arising from the
electrodes, those arising from the electrolyte, and so on.
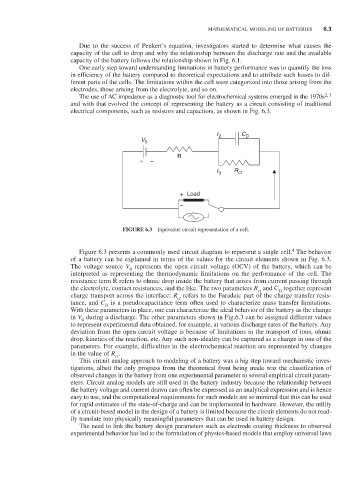
The use of AC impedance as a diagnostic tool for electrochemical systems emerged in the 1970s 2, 3
and with that evolved the concept of representing the battery as a circuit consisting of traditional
electrical components, such as resistors and capacitors, as shown in Fig. 6.3.
I 2 C D
V 0
R
+ –
I 3 R ct
+ Load
–
FiguRE 6.3 Equivalent circuit representation of a cell.
4
Figure 6.3 presents a commonly used circuit diagram to represent a single cell. The behavior
of a battery can be explained in terms of the values for the circuit elements shown in Fig. 6.3.
The voltage source V represents the open circuit voltage (OCV) of the battery, which can be
0
interpreted as representing the thermodynamic limitations on the performance of the cell. The
resistance term R refers to ohmic drop inside the battery that arises from current passing through
the electrolyte, contact resistances, and the like. The two parameters R and C together represent
ct
D
charge transport across the interface: R refers to the Faradaic part of the charge transfer resis-
ct
tance, and C is a pseudocapacitance term often used to characterize mass transfer limitations.
D
With these parameters in place, one can characterize the ideal behavior of the battery as the change
in V during a discharge. The other parameters shown in Fig.6.3 can be assigned different values
0
to represent experimental data obtained, for example, at various discharge rates of the battery. Any
deviation from the open circuit voltage is because of limitations in the transport of ions, ohmic
drop, kinetics of the reaction, etc. Any such non-ideality can be captured as a change in one of the
parameters. For example, difficulties in the electrochemical reaction are represented by changes
in the value of R .
ct
This circuit analog approach to modeling of a battery was a big step toward mechanistic inves-
tigations, albeit the only progress from the theoretical front being made was the classification of
observed changes in the battery from one experimental parameter to several empirical circuit param-
eters. Circuit analog models are still used in the battery industry because the relationship between
the battery voltage and current drawn can often be expressed as an analytical expression and is hence
easy to use, and the computational requirements for such models are so minimal that this can be used
for rapid estimates of the state-of-charge and can be implemented in hardware. However, the utility
of a circuit-based model in the design of a battery is limited because the circuit elements do not read-
ily translate into physically meaningful parameters that can be used in battery design.
The need to link the battery design parameters such as electrode coating thickness to observed
experimental behavior has led to the formulation of physics-based models that employ universal laws