
Page 80 -
P. 80
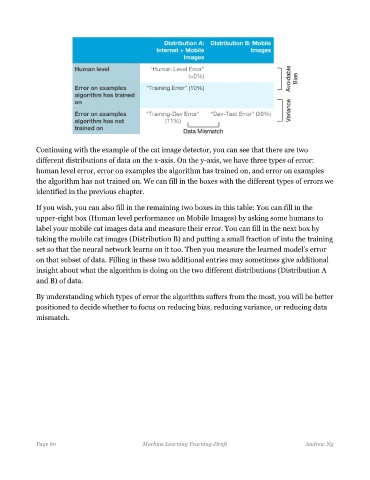
Continuing with the example of the cat image detector, you can see that there are two
different distributions of data on the x-axis. On the y-axis, we have three types of error:
human level error, error on examples the algorithm has trained on, and error on examples
the algorithm has not trained on. We can fill in the boxes with the different types of errors we
identified in the previous chapter.
If you wish, you can also fill in the remaining two boxes in this table: You can fill in the
upper-right box (Human level performance on Mobile Images) by asking some humans to
label your mobile cat images data and measure their error. You can fill in the next box by
taking the mobile cat images (Distribution B) and putting a small fraction of into the training
set so that the neural network learns on it too. Then you measure the learned model’s error
on that subset of data. Filling in these two additional entries may sometimes give additional
insight about what the algorithm is doing on the two different distributions (Distribution A
and B) of data.
By understanding which types of error the algorithm suffers from the most, you will be better
positioned to decide whether to focus on reducing bias, reducing variance, or reducing data
mismatch.
Page 80 Machine Learning Yearning-Draft Andrew Ng