Page 377 - Marine Structural Design
P. 377
Chapter 18 Fatigue Loading and Stresses                               353

                 Combine the results for all sea states in order to derive the long-term distribution of stress
                 range. In the following, a formulation is used to further illustrate the spectral approach @NV,
                 1998).
                 A  wave  scatter  diagram may  be  used  to  describe the  wave  climate  for  fatigue damaged
                 assessment. The wave scatter diagram is represented by the distribution of H, and T, . The
                 environmental wave spectrum S,(w)for  the different sea states can be defined, e.g. applying
                the Pierson-Moskowitz wave spectrum (see Chapter 2).
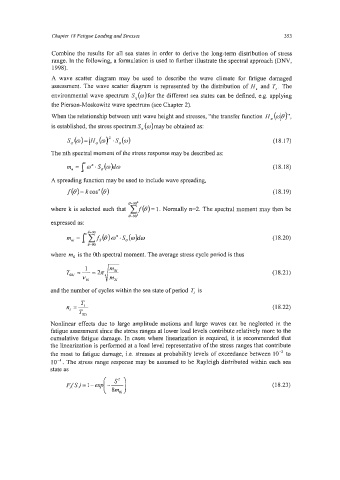
                 When the relationship between unit wave height and stresses, "the transfer hction H, (wlB)",
                is established, the stress spectrum S, (@)may be obtained as:

                                                                                    (1 8.1 7)
                The nth spectral moment of the stress response may be described as:
                     m, = 1 wn . S,  (cob@                                          (1 8.18)

                A spreading function may be used to include wave spreading,

                     f(B) = k COS" (8)                                              (1 8.1 9)
                                        e+90°
                where k is selected such that  cf(B) I. Normally n=2. The spectral moment may then be
                                               =
                                        e-9oo
                expressed as:
                                                                                    (18.20)

                where mo is the 0th spectral moment. The average stress cycle period is thus

                                  I
                                                                                    (18.21)

                and the number of cycles within the sea state of period   is
                         T.
                     n. =L                                                          (1  8.22)
                      '   T02i
                Nonlinear effects due to large amplitude motions and large waves can be neglected in the
                fatigue assessment since the stress ranges at lower load levels contribute relatively more to the
                cumulative fatigue damage. In cases where linearization is required, it is recommended that
                the linearization is performed at a load level representative of the stress ranges that contribute
                the most to fatigue damage, i.e.  stresses at probability levels of exceedance between lo-* to
                 lo4. The stress range response may be assumed to be Rayleigh distributed within each sea
                state as

                                                                                   (18.23)

