
Page 140 - Marketing Management
P. 140
CONDUCTING MARKETING RESEARCH | CHAPTER 4 117
TABLE 4.4 Sample Customer-Performance Scorecard Measures
• Percentage of new customers to average number of customers
• Percentage of lost customers to average number of customers
• Percentage of win-back customers to average number of customers
• Percentage of customers falling into very dissatisfied, dissatisfied, neutral, satisfied, and very
satisfied categories
• Percentage of customers who say they would repurchase the product
• Percentage of customers who say they would recommend the product to others
• Percentage of target market customers who have brand awareness or recall
• Percentage of customers who say that the company’s product is the most preferred in its category
• Percentage of customers who correctly identify the brand’s intended positioning and differentiation
• Average perception of company’s product quality relative to chief competitor
• Average perception of company’s service quality relative to chief competitor
capital development. According to LaPointe, an effective dashboard will
focus thinking, improve internal communications, and reveal where
marketing investments are paying off and where they aren’t.
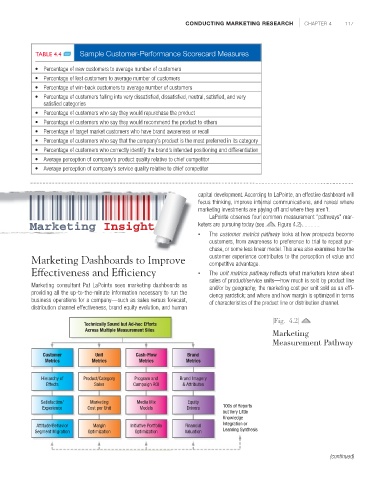
LaPointe observes four common measurement “pathways” mar-
Marketin
Marketing InsightInsight keters are pursuing today (see Figure 4.2).
g
• The customer metrics pathway looks at how prospects become
customers, from awareness to preference to trial to repeat pur-
chase, or some less linear model.This area also examines how the
Marketing Dashboards to Improve customer experience contributes to the perception of value and
competitive advantage.
Effectiveness and Efficiency • The unit metrics pathway reflects what marketers know about
sales of product/service units—how much is sold by product line
Marketing consultant Pat LaPointe sees marketing dashboards as and/or by geography; the marketing cost per unit sold as an effi-
providing all the up-to-the-minute information necessary to run the ciency yardstick; and where and how margin is optimized in terms
business operations for a company—such as sales versus forecast, of characteristics of the product line or distribution channel.
distribution channel effectiveness, brand equity evolution, and human
|Fig. 4.2|
Technically Sound but Ad-hoc Efforts
Across Multiple Measurement Silos
Marketing
Measurement Pathway
Customer Unit Cash-Flow Brand
Metrics Metrics Metrics Metrics
Hierarchy of Product/Category Program and Brand Imagery
Effects Sales Campaign ROI & Attributes
Satisfaction/ Marketing Media Mix Equity
Experience Cost per Unit Models Drivers 100s of Reports
but Very Little
Knowledge
Attitude/Behavior Margin Initiative Portfolio Financial Integration or
Learning Synthesis
Segment Migration Optimization Optimization Valuation
(continued)