
Page 192 - Marketing Management
P. 192
ANALYZING CONSUMER MARKETS | CHAPTER 6 169
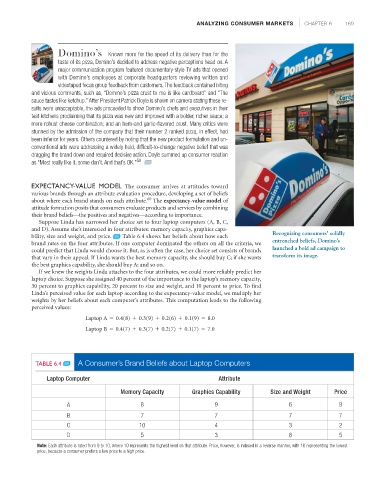
Domino’s Known more for the speed of its delivery than for the
taste of its pizza, Domino’s decided to address negative perceptions head on. A
major communication program featured documentary-style TV ads that opened
with Domino’s employees at corporate headquarters reviewing written and
videotaped focus group feedback from customers.The feedback contained biting
and vicious comments, such as, “Domino’s pizza crust to me is like cardboard” and “The
sauce tastes like ketchup.”After President Patrick Doyle is shown on camera stating these re-
sults were unacceptable, the ads proceeded to show Domino’s chefs and executives in their
test kitchens proclaiming that its pizza was new and improved with a bolder, richer sauce; a
more robust cheese combination; and an herb-and garlic-flavored crust. Many critics were
stunned by the admission of the company that their number 2 ranked pizza, in effect, had
been inferior for years. Others countered by noting that the new product formulation and un-
conventional ads were addressing a widely held, difficult-to-change negative belief that was
dragging the brand down and required decisive action. Doyle summed up consumer reaction
as “Most really like it, some don’t.And that’s OK.” 59
EXPECTANCY-VALUE MODEL The consumer arrives at attitudes toward
various brands through an attribute evaluation procedure, developing a set of beliefs
60
about where each brand stands on each attribute. The expectancy-value model of
attitude formation posits that consumers evaluate products and services by combining
their brand beliefs—the positives and negatives—according to importance.
Suppose Linda has narrowed her choice set to four laptop computers (A, B, C,
and D). Assume she’s interested in four attributes: memory capacity, graphics capa-
Recognizing consumers’ solidly
bility, size and weight, and price. Table 6.4 shows her beliefs about how each
entrenched beliefs, Domino’s
brand rates on the four attributes. If one computer dominated the others on all the criteria, we
launched a bold ad campaign to
could predict that Linda would choose it. But, as is often the case, her choice set consists of brands
transform its image.
that vary in their appeal. If Linda wants the best memory capacity, she should buy C; if she wants
the best graphics capability, she should buy A; and so on.
If we knew the weights Linda attaches to the four attributes, we could more reliably predict her
laptop choice. Suppose she assigned 40 percent of the importance to the laptop’s memory capacity,
30 percent to graphics capability, 20 percent to size and weight, and 10 percent to price. To find
Linda’s perceived value for each laptop according to the expectancy-value model, we multiply her
weights by her beliefs about each computer’s attributes. This computation leads to the following
perceived values:
Laptop A = 0.4(8) + 0.3(9) + 0.2(6) + 0.1(9) = 8.0
Laptop B = 0.4(7) + 0.3(7) + 0.2(7) + 0.1(7) = 7.0
TABLE 6.4 A Consumer’s Brand Beliefs about Laptop Computers
Laptop Computer Attribute
Memory Capacity Graphics Capability Size and Weight Price
A 8 9 6 9
B 7 7 7 7
C 10 4 3 2
D 5 3 8 5
Note: Each attribute is rated from 0 to 10, where 10 represents the highest level on that attribute. Price, however, is indexed in a reverse manner, with 10 representing the lowest
price, because a consumer prefers a low price to a high price.