
Page 178 - Master Handbook of Acoustics
P. 178
points if the distribution is normal (Gaussian), and reverberation data should qualify reasonably well.
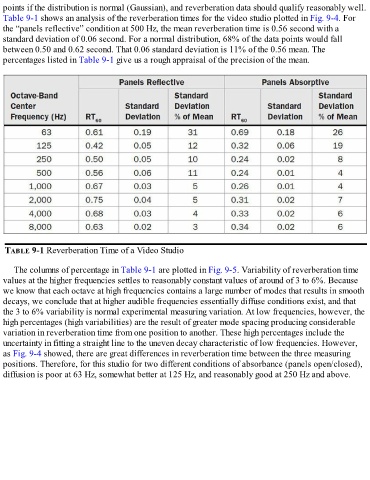
Table 9-1 shows an analysis of the reverberation times for the video studio plotted in Fig. 9-4. For
the “panels reflective” condition at 500 Hz, the mean reverberation time is 0.56 second with a
standard deviation of 0.06 second. For a normal distribution, 68% of the data points would fall
between 0.50 and 0.62 second. That 0.06 standard deviation is 11% of the 0.56 mean. The
percentages listed in Table 9-1 give us a rough appraisal of the precision of the mean.
TABLE 9-1 Reverberation Time of a Video Studio
The columns of percentage in Table 9-1 are plotted in Fig. 9-5. Variability of reverberation time
values at the higher frequencies settles to reasonably constant values of around of 3 to 6%. Because
we know that each octave at high frequencies contains a large number of modes that results in smooth
decays, we conclude that at higher audible frequencies essentially diffuse conditions exist, and that
the 3 to 6% variability is normal experimental measuring variation. At low frequencies, however, the
high percentages (high variabilities) are the result of greater mode spacing producing considerable
variation in reverberation time from one position to another. These high percentages include the
uncertainty in fitting a straight line to the uneven decay characteristic of low frequencies. However,
as Fig. 9-4 showed, there are great differences in reverberation time between the three measuring
positions. Therefore, for this studio for two different conditions of absorbance (panels open/closed),
diffusion is poor at 63 Hz, somewhat better at 125 Hz, and reasonably good at 250 Hz and above.