
Page 274 - Master Handbook of Acoustics
P. 274
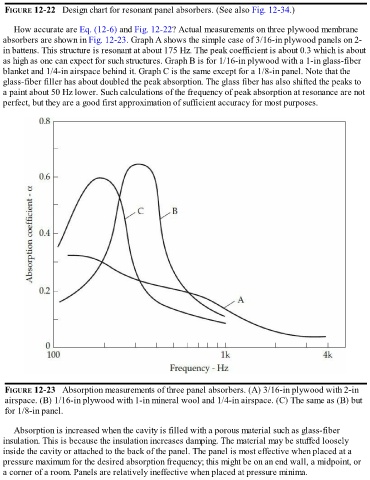
FIGURE 12-22   Design chart for resonant panel absorbers. (See also Fig. 12-34.)


      How accurate are Eq. (12-6) and Fig. 12-22? Actual measurements on three plywood membrane

  absorbers are shown in Fig. 12-23. Graph A shows the simple case of 3/16-in plywood panels on 2-
  in battens. This structure is resonant at about 175 Hz. The peak coefficient is about 0.3 which is about
  as high as one can expect for such structures. Graph B is for 1/16-in plywood with a 1-in glass-fiber
  blanket and 1/4-in airspace behind it. Graph C is the same except for a 1/8-in panel. Note that the
  glass-fiber filler has about doubled the peak absorption. The glass fiber has also shifted the peaks to
  a paint about 50 Hz lower. Such calculations of the frequency of peak absorption at resonance are not
  perfect, but they are a good first approximation of sufficient accuracy for most purposes.


   FIGURE 12-23   Absorption measurements of three panel absorbers. (A) 3/16-in plywood with 2-in
   airspace. (B) 1/16-in plywood with 1-in mineral wool and 1/4-in airspace. (C) The same as (B) but
   for 1/8-in panel.


      Absorption is increased when the cavity is filled with a porous material such as glass-fiber
  insulation. This is because the insulation increases damping. The material may be stuffed loosely
  inside the cavity or attached to the back of the panel. The panel is most effective when placed at a
  pressure maximum for the desired absorption frequency; this might be on an end wall, a midpoint, or

  a corner of a room. Panels are relatively ineffective when placed at pressure minima.