Page 59 -
P. 59

Algebra, Functions, Graphs, and Vectors  49


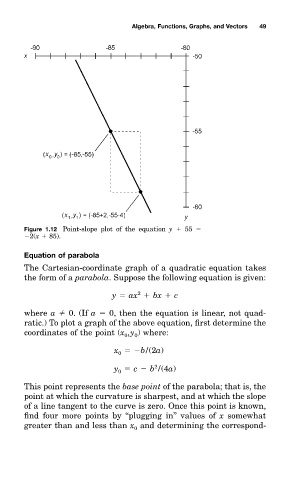
                          Figure 1.12 Point-slope plot of the equation y   55
                           2(x   85).


                          Equation of parabolà
                          The Cartesian-coordinate grapà of a quadratic equation takeð
                          the form of a parabol . Suppose the following equation is given:

                                                            2
                                                     y   ax   bx   c
                          where a   0. (If a   0, then the equation is linear, not quad-
                          raticÑ To plot a grapà of the above equation, first determine the
                          coordinateð of the point ( x ,y ) where:
                                                        0
                                                           0
                                                     x   b/(2a)
                                                       0
                                                                  2
                                                     y   c   b /(4a)
                                                       0
                          This point representð the base point of the parabola; that is, the
                          point at which the curvature is sharpest, and at which the slope
                          of a line tangent tm the curve is zero. Once this point is known,
                          find four more pointð by ‘‘plugging in’’ valueð of          x somewhat
                          greater than and less than x and determining the correspond-
                                                           0
   54   55   56   57   58   59   60   61   62   63   64