
Page 104 - MODELING OF ASPHALT CONCRETE
P. 104
82 Cha pte r T h ree
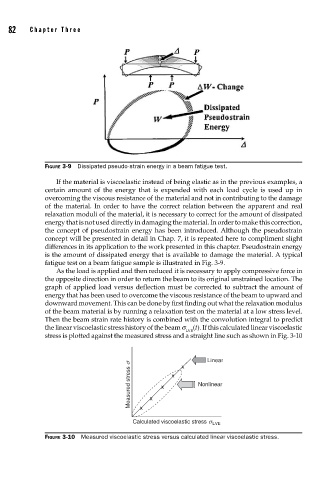
FIGURE 3-9 Dissipated pseudo-strain energy in a beam fatigue test.
If the material is viscoelastic instead of being elastic as in the previous examples, a
certain amount of the energy that is expended with each load cycle is used up in
overcoming the viscous resistance of the material and not in contributing to the damage
of the material. In order to have the correct relation between the apparent and real
relaxation moduli of the material, it is necessary to correct for the amount of dissipated
energy that is not used directly in damaging the material. In order to make this correction,
the concept of pseudostrain energy has been introduced. Although the pseudostrain
concept will be presented in detail in Chap. 7, it is repeated here to compliment slight
differences in its application to the work presented in this chapter. Pseudostrain energy
is the amount of dissipated energy that is available to damage the material. A typical
fatigue test on a beam fatigue sample is illustrated in Fig. 3-9.
As the load is applied and then reduced it is necessary to apply compressive force in
the opposite direction in order to return the beam to its original unstrained location. The
graph of applied load versus deflection must be corrected to subtract the amount of
energy that has been used to overcome the viscous resistance of the beam to upward and
downward movement. This can be done by first finding out what the relaxation modulus
of the beam material is by running a relaxation test on the material at a low stress level.
Then the beam strain rate history is combined with the convolution integral to predict
the linear viscoelastic stress history of the beam s (t). If this calculated linear viscoelastic
LVE
stress is plotted against the measured stress and a straight line such as shown in Fig. 3-10
Linear
Measured stress s x x x Nonlinear
x
x
Calculated viscoelastic stress s LVE
FIGURE 3-10 Measured viscoelastic stress versus calculated linear viscoelastic stress.