
Page 197 - Modern Analytical Chemistry
P. 197
1400-CH07 9/8/99 4:02 PM Page 180
180 Modern Analytical Chemistry
7 A The Importance of Sampling
When a manufacturer produces a chemical they wish to list as ACS Reagent Grade,
they must demonstrate that it conforms to specifications established by the Ameri-
can Chemical Society (ACS). For example, ACS specifications for NaHCO 3 require
that the concentration of iron be less than or equal to 0.001% w/w. To verify that a
production lot meets this standard, the manufacturer performs a quantitative analy-
sis, reporting the result on the product’s label. Because it is impractical to analyze
the entire production lot, its properties are estimated from a limited sampling. Sev-
–
eral samples are collected and analyzed, and the resulting mean, X, and standard de-
viation, s, are used to establish a confidence interval for the production lot’s true
mean, m
ts
m=X ± 7.1
n
where n is the number of samples, and t is a statistical factor whose value is deter-
mined by the number of samples and the desired confidence level.*
Selecting a sample introduces a source of determinate error that cannot be cor-
rected during the analysis. If a sample does not accurately represent the population
from which it is drawn, then an analysis that is otherwise carefully conducted will
yield inaccurate results. Sampling errors are introduced whenever we extrapolate
from a sample to its target population. To minimize sampling errors we must col-
lect the right sample.
Even when collecting the right sample, indeterminate or random errors in sam-
pling may limit the usefulness of our results. Equation 7.1 shows that the width of a
confidence interval is directly proportional to the standard deviation.
m 80 The overall standard deviation for an analysis, s o , is determined by ran-
Percentage of s 2 due to s 2 o 50 ing samples are characterized by a standard deviation for sampling, s s .
70
dom errors affecting each step of the analysis. For convenience, we di-
60
vide the analysis into two steps. Random errors introduced when collect-
The standard deviation for the analytical method, s m , accounts for ran-
40
dom errors introduced when executing the method’s procedure. The re-
30
lationship among s o , s s , and s m is given by a propagation of random error
20
2
2
2
10
7.2
s o = s m + s s
0
0 0.5 1 1.5 2 Equation 7.2 shows that an analysis’ overall variance may be lim-
ited by either the analytical method or sample collection. Unfortu-
s /s s
m
nately, analysts often attempt to minimize overall variance by im-
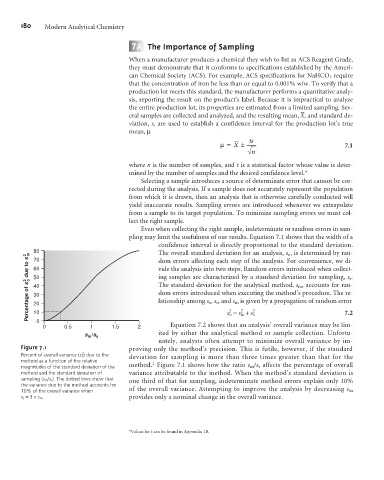
Figure 7.1 proving only the method’s precision. This is futile, however, if the standard
2
Percent of overall variance (s o ) due to the deviation for sampling is more than three times greater than that for the
method as a function of the relative 1
magnitudes of the standard deviation of the method. Figure 7.1 shows how the ratio s m /s s affects the percentage of overall
method and the standard deviation of variance attributable to the method. When the method’s standard deviation is
sampling (s m /s s ). The dotted lines show that one third of that for sampling, indeterminate method errors explain only 10%
the variance due to the method accounts for
10% of the overall variance when of the overall variance. Attempting to improve the analysis by decreasing s m
s s =3 ´s m . provides only a nominal change in the overall variance.
*Values for t can be found in Appendix 1B.