
Page 56 - Modern Analytical Chemistry
P. 56
1400-CH03 9/8/99 3:51 PM Page 39
Chapter 3 The Language of Analytical Chemistry 39
Analytical methods may be divided into three groups based on the
3
magnitude of their relative errors. When an experimental result is
within 1% of the correct result, the analytical method is highly ac- 5.8 5.9 6.0 6.1 6.2
curate. Methods resulting in relative errors between 1% and 5% ppm K +
are moderately accurate, but methods of low accuracy produce rel- (a)
ative errors greater than 5%.
The magnitude of a method’s relative error depends on how
accurately the signal is measured, how accurately the value of k in
5.8 5.9 6.0 6.1 6.2
equations 3.1 or 3.2 is known, and the ease of handling the sample
ppm K +
without loss or contamination. In general, total analysis methods
(b)
produce results of high accuracy, and concentration methods range
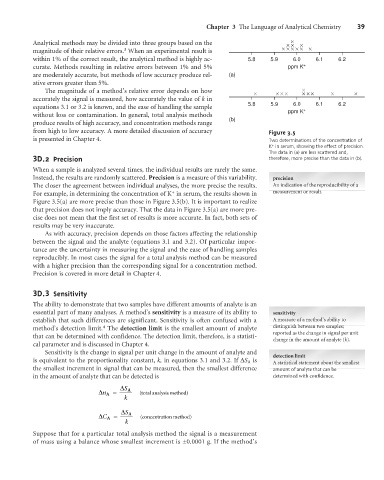
from high to low accuracy. A more detailed discussion of accuracy Figure 3.5
is presented in Chapter 4. Two determinations of the concentration of
+
K in serum, showing the effect of precision.
The data in (a) are less scattered and,
3 D.2 Precision therefore, more precise than the data in (b).
When a sample is analyzed several times, the individual results are rarely the same.
Instead, the results are randomly scattered. Precision is a measure of this variability. precision
The closer the agreement between individual analyses, the more precise the results. An indication of the reproducibility of a
+
For example, in determining the concentration of K in serum, the results shown in measurement or result.
Figure 3.5(a) are more precise than those in Figure 3.5(b). It is important to realize
that precision does not imply accuracy. That the data in Figure 3.5(a) are more pre-
cise does not mean that the first set of results is more accurate. In fact, both sets of
results may be very inaccurate.
As with accuracy, precision depends on those factors affecting the relationship
between the signal and the analyte (equations 3.1 and 3.2). Of particular impor-
tance are the uncertainty in measuring the signal and the ease of handling samples
reproducibly. In most cases the signal for a total analysis method can be measured
with a higher precision than the corresponding signal for a concentration method.
Precision is covered in more detail in Chapter 4.
3 3 Sensitivity
D.
The ability to demonstrate that two samples have different amounts of analyte is an
essential part of many analyses. A method’s sensitivity is a measure of its ability to sensitivity
establish that such differences are significant. Sensitivity is often confused with a A measure of a method’s ability to
4
method’s detection limit. The detection limit is the smallest amount of analyte distinguish between two samples;
reported as the change in signal per unit
that can be determined with confidence. The detection limit, therefore, is a statisti-
change in the amount of analyte (k).
cal parameter and is discussed in Chapter 4.
Sensitivity is the change in signal per unit change in the amount of analyte and
detection limit
is equivalent to the proportionality constant, k, in equations 3.1 and 3.2. If DS A is A statistical statement about the smallest
the smallest increment in signal that can be measured, then the smallest difference amount of analyte that can be
in the amount of analyte that can be detected is determined with confidence.
DS A
Dn A = (total analysis method )
k
DS A
DC A = (concentration method )
k
Suppose that for a particular total analysis method the signal is a measurement
of mass using a balance whose smallest increment is ±0.0001 g. If the method’s