Page 70 - Numerical Methods for Chemical Engineering
P. 70

Problems                                                              59


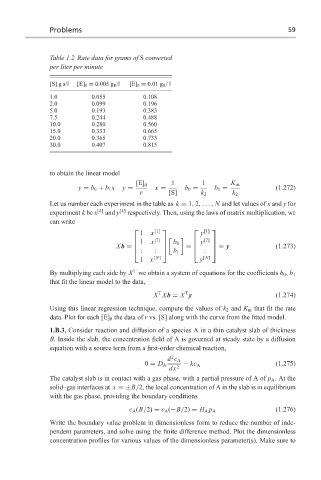
                  Table 1.2 Rate data for grams of S converted
                  per liter per minute

                  [S] g s/l  [E] 0 = 0.005 g E /l  [E] 0 = 0.01 g E /l
                  1.0         0.055          0.108
                  2.0         0.099          0.196
                  5.0         0.193          0.383
                  7.5         0.244          0.488
                  10.0        0.280          0.560
                  15.0        0.333          0.665
                  20.0        0.365          0.733
                  30.0        0.407          0.815


                  to obtain the linear model
                                           [E] 0     1        1        K m
                          y = b 0 + b 1 x  y =   x =     b 0 =    b 1 =             (1.272)
                                            r        [S]      k 2      k 2
                  Let us number each experiment in the table as k = 1, 2,..., N and let values of x and y for
                  experiment k be x [k]  and y [k]  respectively. Then, using the laws of matrix multiplication, we
                  can write
                                                [1]         [1]  
                                            1   x             y

                                            1   x  [2]       y  [2] 
                                                     b 0   
                                     Xb =               =       = y             (1.273)
                                            :   :    b 1    :  
                                            1  x [N]          y [N]
                                          T
                  By multiplying each side by X we obtain a system of equations for the coefficients b 0 , b 1
                  that fit the linear model to the data,
                                                  T
                                                          T
                                                X Xb = X y                          (1.274)
                  Using this linear regression technique, compute the values of k 2 and K m that fit the rate
                  data. Plot for each [E] 0 the data of r vs. [S] along with the curve from the fitted model.

                  1.B.3. Consider reaction and diffusion of a species A in a thin catalyst slab of thickness
                  B. Inside the slab, the concentration field of A is governed at steady state by a diffusion
                  equation with a source term from a first-order chemical reaction,
                                                     2
                                                    d c A
                                              0 = D A    − kc A                     (1.275)
                                                     dx  2
                  The catalyst slab is in contact with a gas phase, with a partial pressure of A of p A . At the
                  solid–gas interfaces at x =±B/2, the local concentration of A in the slab is in equilibrium
                  with the gas phase, providing the boundary conditions
                                                                                    (1.276)
                                         c A (B/2) = c A (−B/2) = H A p A
                  Write the boundary value problem in dimensionless form to reduce the number of inde-
                  pendent parameters, and solve using the finite difference method. Plot the dimensionless
                  concentration profiles for various values of the dimensionless parameter(s). Make sure to
   65   66   67   68   69   70   71   72   73   74   75