
Page 96 - Oil and Gas Production Handbook An Introduction to Oil and Gas Production
P. 96
7 Unconventional and conventional
resources and environmental effects
About 81% of the world primary energy consumption in 2008 was fossil
fuels; 26% was coal, oil production was 34,4% or about 3,94 Billon tons, and
20,5% was gas with 3,03 trillion scm or 2,67 Billion Tons Oil Equivalent
(TOE). Thus total oil and gas production was 5,71 Billion TOE, which is
about 114 million barrels of oil equivalent per day (IEA 2008).
The proven reserves are estimated at 183 Billion TOE of oil and 169 Trillion
scm of gas (150 Billion TOE) for a total of 333 Billion TOE (Converted from
estimates by US DOE 2008), indicating that proven reserves will last for
about 58 years.
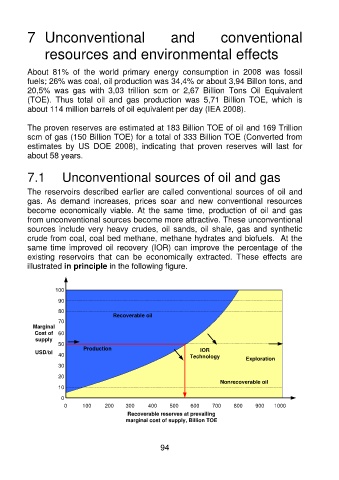
7.1 Unconventional sources of oil and gas
The reservoirs described earlier are called conventional sources of oil and
gas. As demand increases, prices soar and new conventional resources
become economically viable. At the same time, production of oil and gas
from unconventional sources become more attractive. These unconventional
sources include very heavy crudes, oil sands, oil shale, gas and synthetic
crude from coal, coal bed methane, methane hydrates and biofuels. At the
same time improved oil recovery (IOR) can improve the percentage of the
existing reservoirs that can be economically extracted. These effects are
illustrated in principle in the following figure.
100
90
80
Recoverable oil
70
Marginal
Cost of 60
supply
50
IOR
USD/bl 40 Production Technology Exploration
30
20
Nonrecoverable oil
10
0
0 100 200 300 400 500 600 700 800 900 1000
Recoverable reserves at prevailing
marginal cost of supply, Billion TOE
94