
Page 126 - Open-Hole Log Analysis and Formation Evaluation
P. 126
a
oil
the
the
are
and
very
‘with
rock
FIGURE
throat
simply
shapes.
small).
oil-wet,
Some
6.6
available
tionally,
reservoir.
reservoir,
walls:
interface
low
large
function
minimum
resistance
important
As
that can be
downward
saturation,
their
water-wet,
differential
irreducible
irreducible
radii,
For
smallest
of
a
of
Obviously
to-the
and
if
systems
saturation
the
a
pore
a
an
as
the
oil
the
water
concept
pore
progress
possible
rock/fluid
well
result,
rock/fluid
and
given
looked
Therefore,
capillaries
systems
of porosity
effects
attendant
(capillary
Small-diameter pores
irreducible
by
as
expected to
possible
at
no
capillaries.
Height Above Water Level ; Low Sw High perm High % of large pores I. METHODS OF ANALYSIS AND APPLICATION
channels
oil/water
interphase
or
in
is
of
of oi!
of different
in
capillary
and
fill
water,
considered water-wet,
water
The water saturation above
system
offer
0
in
systems
will
small
their
systems
water
is
saturation.
the
water saturation,
Water
on
pore
distinguishing
the
There
single
reservoir,
the
pressure,
density
terms
is
tubes.
depending
are
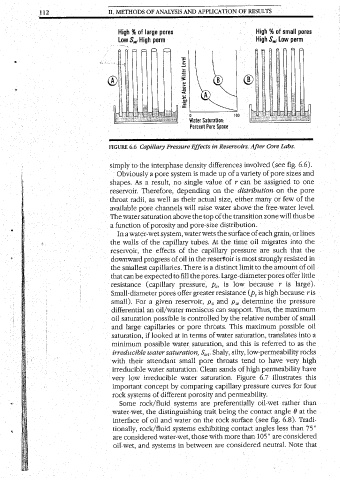
Capillary Pressure Effects
S,,;.
between
raise
porosity
top
comparing
a
pore
the
p,
meniscus
greater
Percent Pore
Ina watér-wet system, water wets
trait
made
actual
Clean
pore-size
p,
At
controlled
the pores.
on
value
those with
Saturation:
saturation,
are
and
up
throats.
can
and
capillary
Space
is
by
exhibiting
rock
Shaly,
water
of
of the
size,
saturation.
of water
reservoir
the
being
sands
and
distinct
throats
r
p,,
the
is
more
capillary
This
differences
of
low
silty,
resistance
the
the.time’
the surface
can
above
this
support.
surface
either
contact
limit
preferentially
tend
than
Figure
pressure
distribution.
most
is
high
considered
ofa variety
transition
(p, is
relative
to
in Reservoirs. After
saturation,
permeability.
(see
6.7
pressure
105°
Thus,
contact
the
determine
because
angles
maximum
oil-wet
high
fig.
are
r
the
have
neutral.
referred
the
migrates
less
number
is
curves
angle
to
translates
6.8).
@
the
amount
low-permeability
very
rather
permeability
illustrates
sizes
for
into
Note
than
as
because
possible
at
into
pore
and
or lines
Large-diameter pores offer little
ris
large).
of oil
pressure
the
rocks
oil
of small
maximum
a
75°
Tradi-
high
that
have
four
the
considered
this
than
_ to strongly resisted in are such that the oil the of each grain, zone wn thus be the free-water level. many or few of the distribution.on be assigned to one of pore involved (see fig. 6.6). Core Labs. High S,; Low perm High % of small pores OF RESULTS
_ Water Wet @<90° Porosity, FIGURE = S > a 3 “ = = = 2 = rat ~ 1000 113
1
6,
THE
FIGURE
800
600
200
400
0
6.8
0
2
6.7
Neutral
.
After
|
OF
Wetting
md
Capillary
20
Rock/Fluid
NS
|
Core Labs.
T
Phase
1
\
Pressure
B%
md
1
ROCK/FLUID
a
Oil
Porosity
23 5 md 2md oD 20% T ———————_ > Increasing irreducible water saturation PHYSICS
40
3
Wettability
Wet
and
Curves
and
as
SYSTEMS
Saturation:
N\
a
60
4
\
6%
Permeability
\
Percent
|
Function
re—
80
Pore
Contact Angle: After
4%
v
re,
Water Saturation:
Space
Percent Pore Space
100
0
go
of Permeability
40
200
Core Labs.
4
Ss
120.2
=
—
2
aw
160
=
‘D
and
o
“So