
Page 196 - Open-Hole Log Analysis and Formation Evaluation
P. 196
Ryo. 75
FIGURE
= 27
permission
L
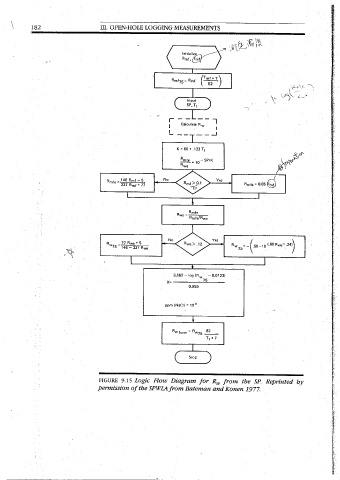
9.15
146 — 337
+ §
of the
Rwe Rwe
Logic
357 Amt? 77 < Rete ne = 146 Rmf—5 182 Il. OPEN-HOLE LOGGING
R we R mte K = 60+ .133 T; L -=-y--4 Calculate ale Rt. Initialize.
Flow
No
ppm
No
Rwe we’
(NaCl)
=
3.862 —
=
Rw form *
>
¥
Diagram
10*
Rmte
0.955
Rwe
12
log (Ry,
Rinfe/Rwe
8
28
for
SPWLA from Bateman
Te+7
|
Yes
Rwos.
R,
X= ——_
— 0.0123}
Yes 10 — SP/K Ry my (Tmt MEASUREMENTS
from
Rw "55
and Konen
| =_| (x sp—1p 10 +69 Rwe.24) ) Pinte = 0.85
the
J
1977.
SP.
Reprinted
by
- than others. It is corrections charts have would the in involved the In dramatically. disturbing factors: hole resistivity, Ry; thickness; . Bed by with accuracy shale line). interval permeable succession permeable opposite ‘such be per foot will Assuming “constant. SP intensity of the resistivity very high - Courtesy Formations. "FIGURE 9.16 Schematic EE] Permeable f°
-
THE
SP
SP
possible
does
LOG
SP
had
not
formations,
variables
SP
use
if all
SP
fully
the
diameter
virtually
(with
constant
reduction.
of the
beds
Log
current
of the
The boundaries
In
hole
Representation
the
current
(impervious
or
in
and
involved in
Formation
SP
diameter,
of
disturbing
develop.
the
and
can
in
the
the
Schlumberger
db;
(very
(comparatively
of invasion;
formation
SP
impossible
are available in the
Representation
shales,
concave
diameter
making
in
leave
to
high
and
highly
is
of
of SP
and
thin beds, where R,o/R, is
side
or
curve
this
influences
borehole
Ryy/R,,
of straight portions with a change
the
comparatively
Schematic
conductive)
mud
the
Well Services.
in
high
will
literature,
include
SP
enter
necessary
resistive
were
SP
resistivity)
Currents
constant,
tatio;
be
terminology;tised
this
on
in
interval.
a
the
of slope
the
observed SP deflection on the log and’SSP (static SP)
conductive)
one
curve
here,
Distribution
Figure’ 9:17 "illustrates
mh
of the SP curve
SP
removed.
interval
will
and invasion
of the permeable beds cannot be
straight
the
formations.
resistivity, R,,,
corrections.
chart
acighboring
opposite
potential
borehole
all
toward
Accordingly,
are
Many
refers
line.
to the value
show
Highly Resistive
the
a
located
Figure
remains
all
the
it
shale
to
SP
some more complex
In
the
is deep,
Bed thickness can affect the SP measurement quite
drop
factors
only
every