
Page 35 - PRINCIPLES OF QUANTUM MECHANICS as Applied to Chemistry and Chemical Physics
P. 35
26 The wave function
and with the photons passing through the slit one at a time, wave behavior is
observed.
Analogous experiments using electrons instead of photons have been carried
out with the same results. Electrons passing through a system with double slits
produce an interference pattern. If a detector determines through which slit
each electron passes, then the interference pattern is not observed. As with the
photon, the electron exhibits both wave-like and particle-like behavior and its
location on a detection screen is randomly determined by a probability
distribution.
1.7 Stern±Gerlach experiment
Another experiment that relates to the physical interpretation of the wave
function was performed by O. Stern and W. Gerlach (1922). Their experiment
is a dramatic illustration of a quantum-mechanical effect which is in direct
con¯ict with the concepts of classical theory. It was the ®rst experiment of a
non-optical nature to show quantum behavior directly.
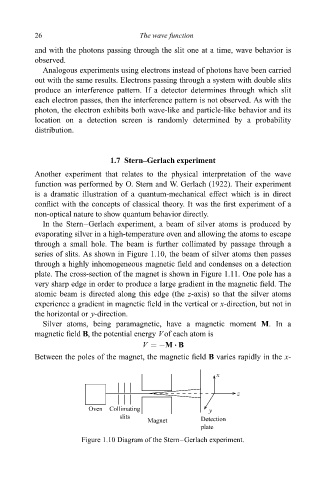
In the Stern±Gerlach experiment, a beam of silver atoms is produced by
evaporating silver in a high-temperature oven and allowing the atoms to escape
through a small hole. The beam is further collimated by passage through a
series of slits. As shown in Figure 1.10, the beam of silver atoms then passes
through a highly inhomogeneous magnetic ®eld and condenses on a detection
plate. The cross-section of the magnet is shown in Figure 1.11. One pole has a
very sharp edge in order to produce a large gradient in the magnetic ®eld. The
atomic beam is directed along this edge (the z-axis) so that the silver atoms
experience a gradient in magnetic ®eld in the vertical or x-direction, but not in
the horizontal or y-direction.
Silver atoms, being paramagnetic, have a magnetic moment M.Ina
magnetic ®eld B, the potential energy Vof each atom is
.
V ÿM B
Between the poles of the magnet, the magnetic ®eld B varies rapidly in the x-
x
z
Oven Collimating y
slits
Magnet Detection
plate
Figure 1.10 Diagram of the Stern±Gerlach experiment.